1. Introduction
Globally, climate change has intensified concerns among nations due to its impacts on various socio-economic systems by affecting our natural environment. (Wang et al., 2021). According to Glasser (2019) and Dolchinkov (2024), severe natural disasters such as heat waves, droughts, cyclones, floods, earthquakes, tsunamis, and storms increase the likelihood of severe natural disasters. Among these disasters, floods are the third most common devastating natural hazard globally after storms and earthquakes (Wilby and Keenan, 2012). It becomes more frequent and costly to manage due to climate change. The damage caused by floods has been steadily growing among developing nations (Patri et al., 2022). If they occur with greater frequency and intensity, it can lead to larger financial losses (Arent et al., 2015; Razavi et al., 2020; Wasko et al., 2021a; Wasko et al., 2021b). Consequently, the poor and marginalised are the worst sufferers and vulnerable to them (Patri et al., 2022). However, traditional engineering measures have proven ineffective in mitigating severe flood risk. To better manage and reduce its hazardous effects, it is essential to utilize artificial intelligence (AI) technology. (Li et al., 2022; Dai et al., 2024).
According to the World Health Organization, “Floods are the most frequent type of natural disaster and occur when an overflow of water submerges land that is usually dry. Floods are often caused by heavy rainfall, rapid snowmelt or a storm surge from a tropical cyclone or tsunami in coastal areas.” Floods are the deadliest natural disaster worldwide. It occurs annually in several parts of the world due to the increased population pressure, environmental degradation, and climate instability. Apart from that, the root causes of upswing flood risk are the growing frequency of heavy precipitation, changes in upstream land use, and the steadily rising concentration of people and assets in flood-prone areas (World Meteorological Organization, n.d.).
Additionally, floods are influenced by several climatic phenomena, including temperature patterns, drainage systems, and heavy precipitation, following torrential rainfall, tropical cyclones, and monsoon rains (Douben, 2006; Bates et al., 2008; Kundzewicz et al., 2014). However, there is a shorter time lag between the start of heavy rainfall and the rise in water levels or river flow in smaller and steeper watersheds. It means people may not have as much warning time, resulting in more socio-economic damage due to recurring flood events (Santos et al., 2024). To forecast uncertain future events like floods or effectively manage the impact of floods, it is necessary to use artificial intelligence (AI) like remote sensing (RS), geographic information systems (GIS), machine learning (ML), deep learning (DL) systems, etc., in flood disaster risk management (Akinsoji et al., 2024; Amatebelle et al., 2025; Madushani et al., 2025).
Floods are one of the natural disasters that are entirely beyond human control. Therefore, artificial intelligence (AI) has emerged as one of the possible techniques for addressing the response to flood disasters. It can be useful in flood disaster management by forecasting floods, managing emergency response, and providing early warning to the public (Maheswari et al., 2024). However, geographic information systems (GIS) and remote sensing (RS) have become the most significant methods that are employed for disaster management and spatial data analysis. Remote sensing (RS) is an earth observation technology used to monitor critical hydro-meteorological data, including relative humidity and rainfall, as well as their extreme values that may cause floods. Geographic Information Systems (GIS) is a key component of geospatial technology adopted to record, visualize, store, retrieve, process, and analyse data from remote sensing. It is also possible to map flood risk and other environmental hazard assessments by using GIS (Anusha and Bharathi, 2020; Askar et al., 2022; Munawar et al., 2022; Amatebelle et al., 2025). Machine learning (ML) techniques are the most commonly used method among the several ways to develop AI systems. These techniques are primarily based on the idea of learning exclusively and directly from data. It is crucial to note that the recent improvement in the forecasting accuracy of AI can be attributed to the advancements in machine learning (ML) techniques, particularly those based on deep learning (Santos et al., 2024).
In recent decades, the artificial intelligence (AI) has significantly reduced the impact of floods. It can forecast floods, provide advanced alerts, and coordinate emergency responses, using its enormous computer capacity. AI uses sensors to analyse a variety of data, including terrain, river flow, rainfall, and weather patterns, to predict floods with high accuracy (Riza et al., 2020; Maheswari et al., 2024).
Based on the extensive literature review, we found that previous review papers have specifically examined AI-driven technologies for flood forecasting, including machine learning, deep learning, and data-driven models, such as remote sensing and the Internet of Things. Furthermore, most of these studies have not highlighted the use of both AI algorithms and statistical methods within a single flood forecasting study. Therefore, this study aims to fill that gap by systematically analysing AI techniques and statistical methods using the PRISMA-2020 framework to predict flood events. The novelty of this research lies in its thorough evaluation of both AI and statistical approaches used in flood forecasting. It provides a comprehensive understanding of their applications and also improves the reliability and transparency of flood forecasting systems.
The study attempts to address three research questions in this analysis, which are as follows:
RQ1. Which artificial intelligence techniques are highly used in forecasting coastal flooding?
RQ2. What statistical methods are used most effectively in flood forecasting?
RQ3. Which keywords are frequently used in artificial intelligence-based flood forecasting?
In the present study, we have evaluated the research papers using the following criteria: firstly, the paper has a clear and well-defined research objective. Secondly, the study presents a clear and detailed methodological and data collection approach. This paper applies the scientific PRISMA-2020 guidelines to conduct a systematic literature review and collect data from both Scopus and Web of Science (WOS) databases. Third, the study synthesizes the findings and highlights the research gap. This research analyses have three broad dimensions, including narrating the different artificial intelligence (AI) techniques used by the existing literature, what analytical methods and important factors are used for forecasting floods, and the respective keywords used by the authors in the context of this domain, as mentioned in the existing empirical literature. Fourth, the paper then points out some limitations of the research and, as a result, offers encouraging directions for further investigation.
This work has been categorised into the following areas. The information regarding methodological approach and data collection is presented in Section 2. Section 3 presents the SLR results. Section 4 describes results and discussions, whereas the conclusion with limitations and future research directions is explained in Section 5.
2. Methodology and Data Collection
The following section presents the database sources and data extraction procedures that have been used for data collection, along with specifics of the methodological approach used to conduct a systematic literature review of flood forecasting using artificial intelligence (AI).
2.1 Data sources
The study has employed two major academic data sources, namely Scopus and Web of Science (WOS), to conduct a thorough systematic literature review. Scopus and Web of Science are extensively accepted as two of the most comprehensive and multidisciplinary bibliographic databases, which offer a wide-ranging coverage of peer-reviewed literature (Falagas et al., 2008). Using these two large databases it will improve the quality of the systematic literature review. The rationale for choosing the Scopus database is that it provides a wide coverage of various subject categories, publication years, document types, and sources from more than 5,000 publications globally; patents and financing information (Schotten et al., 2017). WOS is a selective and multidisciplinary database that consists of several specialized indexes arranged either by theme or by the type of content they index. Science Citation Index Expanded (SCIE), Social Sciences Citation Index (SSCI), Arts & Humanities Citation Index (A&HCI), Conference Proceedings Citation Index (CPCI), Books Citation Index (BKCI), and, more recently, Emerging Sources Citation Index (ESCI) are the six primary citation indexes that make up the core collection (WOS CC), the main component of the WOS platform (Carloni et al., 2018; Pranckutė, 2021). Thus, using either Scopus or WOS may introduce biases in results (Mongeon and Paul-Hus, 2016). Therefore, both databases have to be reliable for conducting a thorough systematic literature review (Mongeon et al., 2016; Pranckutė, 2021; Yubo Shi et al., 2023).
2.2 PRISMA-2020 technique
The British Medical Journal (BMJ) has developed the PRISMA-2020 technique, which is commonly used in systematic literature review analysis. PRISMA involves four steps to extract published documents from various databases: identification of documents, screening, eligibility, and inclusion (Echchakoui, 2020; Tripathy et al., 2024). Among the four steps, the identification of documents has played a significant role in developing a plan of action and research protocol (Table 1). This protocol illustrates various aspects, including the keywords used in the search criteria, which database to be utilised, the inclusion and exclusion criteria to be applied, and the research timeframe (Saldanha et al., 2016; Sarkis-Onofre et al., 2021).
Table 1
Research protocol
The PRISMA-2020 framework provides recommendations to enhance the transparency, repeatability, and methodological rigor (Page et al., 2021). It emphasizes a thorough description of each stage of the search strategy, including the study selection, search string, data extraction, quality appraisal, and synthesis. Consequently, researchers can assess the reliability and relevance of the results. In the PRISMA-2020 framework, the risk of bias assessment is a fundamental criterion that evaluates whether systematic errors that potentially skew results in the design or implementation of extracted documents (Higgins et al., 2022; Page et al., 2021). By evaluating the methodological soundness and reporting completeness of each extracted literature, the quality appraisal supports the risk of bias assessment (Reitsma et al., 2009). It provides the clarity of the flood prediction findings, an overview of data sources, extraction methods, validation strategies, and analysis of performance metrics.
As per the PRISMA 2020, a systematic literature review requires a thorough and reproducible search strategy. It involves a clear rationale for selecting databases, employed search terms, and any restrictions used to retrieve the dataset (Page et al., 2021). Furthermore, it should also include the exact search strings and Boolean operators used, and applied inclusion and exclusion criteria. Additionally, explains the steps of the screening of relevant studies and elimination of duplicate records, to ensure transparency in the search process. Figure 1 presents a complete systematic literature review through the PRISMA flow chart.
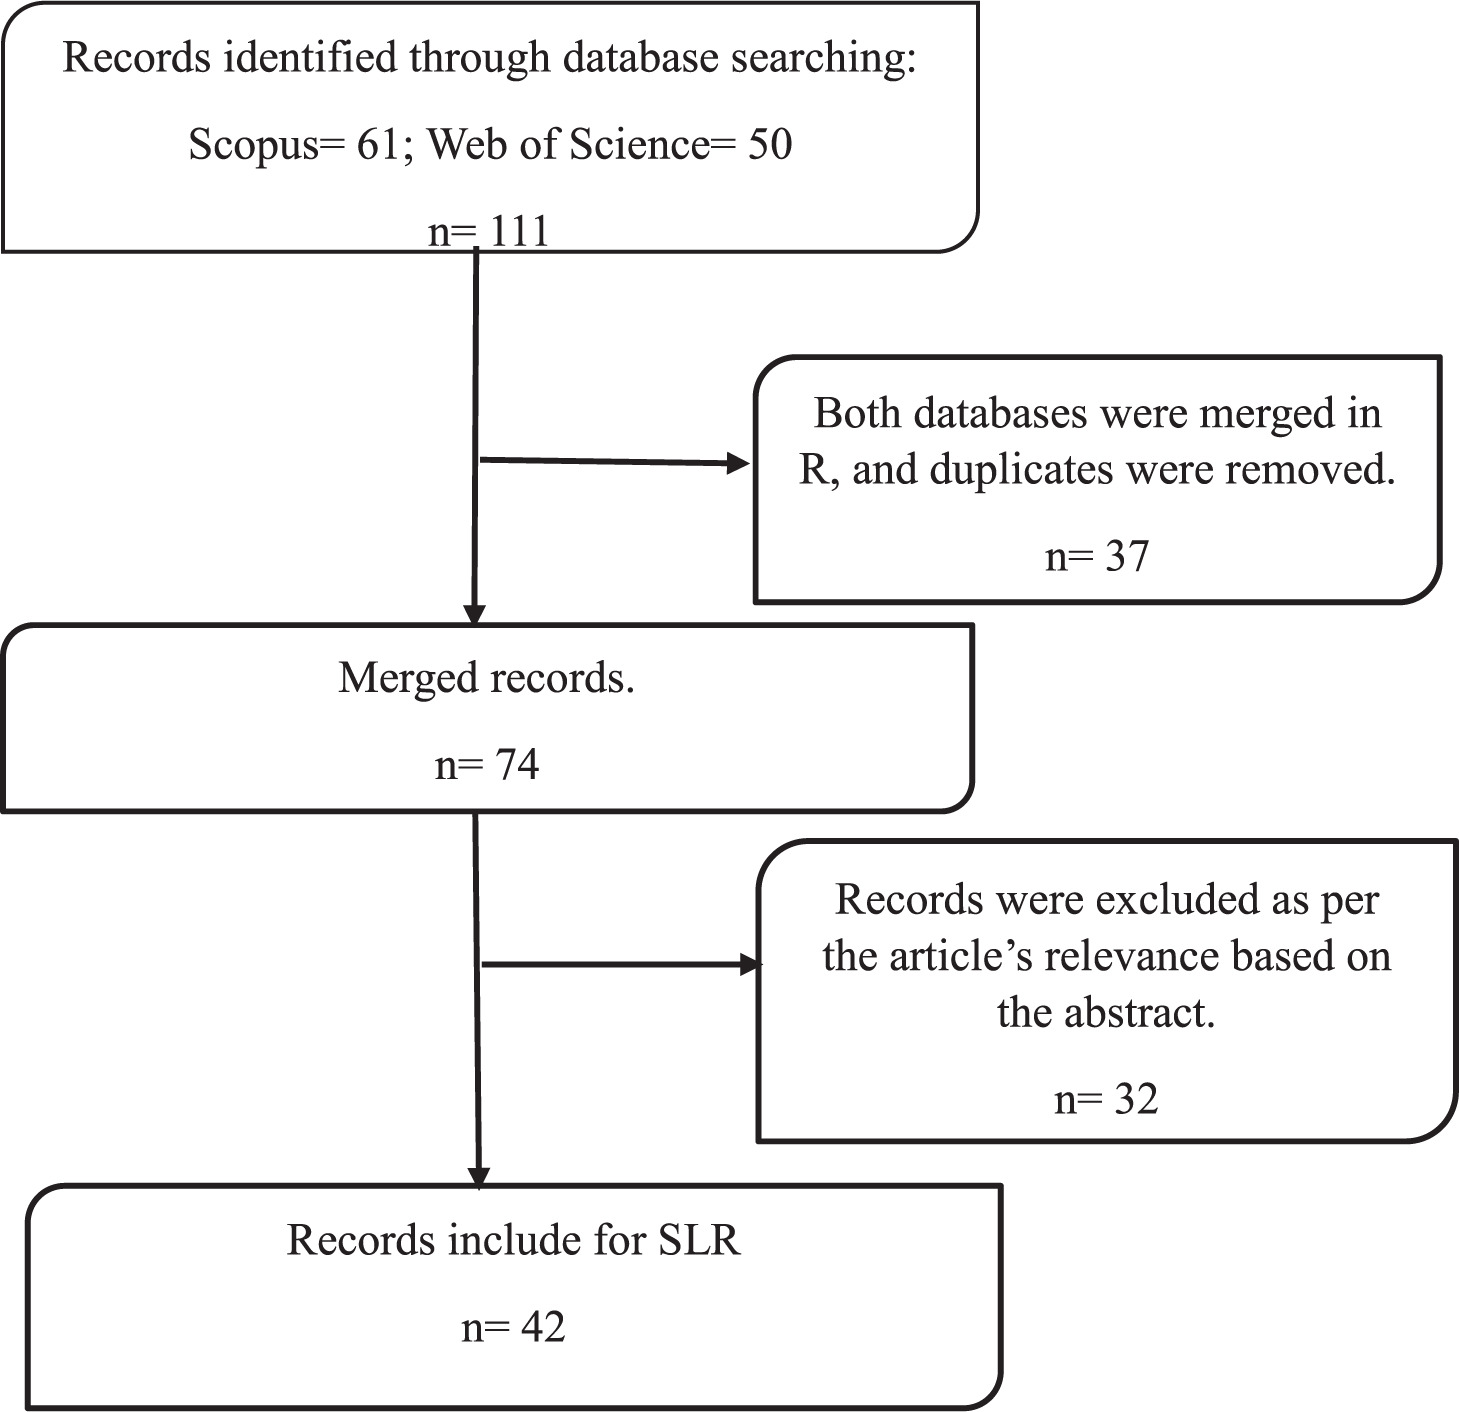
Following the selection of an appropriate database, the next step is to identify some relevant keywords, within the research area for conducting a better systematic literature review. The terms that are significant to the objective of this study are “flood forecasting” and “artificial intelligence.” After the selection of the keywords, the Boolean operator “AND” was used to extract the relevant documents. The Boolean operator is mainly used to distinguish between keyword group combinations. In addition to keyword searches, other inclusion criteria are used for the selection of papers.
Firstly, only English-language papers are selected for our study due to their prevalence in the systematic literature review publications. Secondly, the selection was limited to only articles and review papers from both databases. There is no restriction imposed on any subject area or period for this study. Therefore, the study includes the research papers from the period of 1989 to 2025, as prior to 1989, relevant literature was not available or indexed in the respective databases. “ABS, TITLE, OR KEYWORDS” in Scopus and “All fields” in Web of Science (WOS) were included in the search parameters to assess the pertinent papers; as a result, 335 papers were found (Scopus = 219 and WOS = 116). Additionally, the study excludes different language-based papers from the analysis and includes only open-access papers for a thorough review of the full-screen papers for the SLR. Thus, after implementing all the inclusion and exclusion criteria, the study chose 61 and 50 publications from Scopus and WOS, respectively. The database was searched and the dataset extracted on 13 May 2025 (for the systematic literature review). After retrieving papers from both databases, the R (RStudio) software was used to remove the duplicates and build a merged database of 74 publications by using the “mDbSource” function of the “Bibliometrix” package in R. Following the removal of duplicate papers, 74 publications were converted into .xlsx formats for analysis using Excel spreadsheet and biblioshiny (package of RStudio), respectively. After carefully screening the dataset based on the abstract, this study determined that 42 articles met the study criteria and were eligible for SLR.
2.3 Data analysis: Systematic literature review
SLR is a research methodology that minimizes errors in gathering, identifying, and critically evaluating research studies by adhering to precise and systematic methods. To examine the main ideas of the most recent understanding of a subject through research questions that suggest additional areas of study, it provides the latest literature to researchers in that particular research domain (Mengist et al., 2020; Shaffril et al., 2021; Carrera-Rivera et al., 2022; Maheswari et al., 2024). A systematic literature review was conducted to identify different types of artificial intelligence (AI) techniques and examine the literature for the different factors that influence flood forecasting, and this study provides a qualitative in-depth analysis.
3. Results and discussion
This section analyses relevant literature to examine different artificial intelligence (AI) techniques used for flood forecasting, different statistical methods, factors influencing flood forecasting, and keywords that are frequently used in artificial intelligence-based flood forecasting globally.
3.1 RQ1. Which artificial intelligence techniques are highly used in forecasting coastal flooding?
Artificial intelligence (AI) has emerged as a viable technology that is used for flood forecasting (Al-Rawas et al., 2024). The techniques based on AI are being developed and implemented globally in a variety of applications due to their exceptional capacity to manage complicated input-output relationships (Raza and Khosravi, 2015). Several AI methods have been proposed for the forecasting of natural disasters (Zhu et al., 2019; Albahri et al., 2024). Machine learning (ML) and deep learning (DL) algorithms are subfields of AI techniques that are used for flood forecasting. Machine learning (ML) techniques have made significant contributions to the development of forecasting systems that offer more efficient and economical solutions (Mosavi, 2018). While deep learning techniques are used to analyse meteorological data and satellite imagery to forecast flooding (Sankaranarayanan et al., 2020; Nayak et al., 2022; Sermet and Demir, 2023; Pandey, 2024). A variety of machine learning techniques, including Random Forest (RF), Support Vector Machine (SVM), Artificial Neural Networks (ANN), and Decision Tree (DT), have been used to assess flood susceptibility (Zhu et al., 2024; Maheswari et al., 2024). To determine which technique has been used highest accuracy in flood forecasting, we employ several studies that compare various AI models.
Table 2
Artificial intelligence (AI) techniques for flood forecasting
A group of literature reveals an extensive range of hydrological studies worldwide. For instance, Wu and Chau (2006) analysed the Yangtze River, China, while Faruq et al. (2021) focused on the Kelantan River in Malaysia. Likewise, Sarafanov et al. (2021) examined the Lena River basin, and Wu et al. (2019) explored Flash floods at different lead times in a small mountainous catchment with 69 flash flood events collected from 1984 to 2012 in a mountainous catchment in China. Additionally, Hadi et al. (2024) conducted a study on the Dungun River, and Ahmed et al. (2022) on the Jhelum River, Punjab, Pakistan. Chitwatku and Miyamoto (2023) studied urban floods, examining the Tropical Southeast Asian cities. Furthermore, Mediero et al. (2012) focused on the Manzanares river basin, and Khairuddi et al. (2019) addressed the river stream flow in the tropical environment.
Jiang et al. (2025) contributed to time series forecasting, particularly within the Internet of Things (IoT) and hydrological domains, while Fan et al. (2024) investigated 12 measured flood events from 2000 to 2010, at Maduwang hydrological station in the Bahe river basin. Xu et al. (2025) also evaluated four major flood events: Pakistan 2022, UK 2015, Australia 2022, and Mozambique 2019. Additionally, Someetheram et al. (2025) examined flooding events between the Klang River and the Ampang River of Sri Muda, Malaysia. Fu et al. (2023) observed hourly rainfall data between 2003 and 2021 of 37 rain gauge stations in the PI river basin, China. In a complementary manner, Ye et al. (2021) analyzed the East coast of Peninsular Malaysia (PM), while Cui et al. (2025) predicted the probability of flood occurrence based on 20 influencing factors.
From a more comprehensive continental approach, Jiang et al. (2022) studied flooding trends across Europe. The study of Malinovic-Milicevic et al. (2023) analyzed 20 flood events during the period from October 2001 to December 2019 in the UK. Similarly, the region-specific context of the study of Saman-tray et al. (2023) investigated the Monthly River flow discharge for the period 1969 - 2018 of BP Ghat and Fulertal gauging sites from the Barak River flowing through Barak Valley in Assam, India. Likewise, Sarkar et al. (2022) recognized the nine most relevant flood elements, such as distance from the river, rainfall, and drainage density in northwest Bangladesh. Rostampour et al. (2025) predicted the monthly streamflow of the Leaf River catchment, the United States, while Abbot and Marohasy (2015) studied in Brisbane, the capital of Queensland, Australia. Complementary, some studies include Saba (2016) for the river Chenab, Pakistan, Yaseen et al., 2022 for the Hunza River in Pakistan, Furquim et al., 2018 studied on the town of São Carlos – Brazil, and Agudelo et al. (2018), who investigated the upper Bogotá River, in Colombia between the Florence Bridge and tocancipá, hydrological stations.
From the literature review, we found that all the above studies have employed machine learning (ML) techniques for forecasting flood events. These include Artificial Neural Network (ANN), Support vector machine regression model (SVM), Automated Machine Learning (AutoML), Support vector regression (SVR) model, Logistic regression, k-nearest neighbors, naive bayes, decision tree, random forest, Two-layer back propagation (TLBP), conjugate gradient (CG), and Broyden-Fletcher-Goldfarb-Shanno (BFGS)-based ANN models, genetic programming, Multi-layer perceptron neural networks (MLP-NN) and an adaptive NEUROFUZZY inference system (ANFIS), Model-Agnostic Meta-Learning (MAML), Extreme Learning Machine (ELM), Bayesian Regularized Neural Networks (BRNN), Bayesian Additive Regression Trees (BART), Extreme Gradient Boosting (XGBoost), Hybrid Neural Fuzzy Inference System (HNFIS), Kernel Extreme Learning Machine (KELM), MESAO (Modified Enhanced Snow Ablation Optimization), Analytical Hierarchy Process (AHP) respectively.
This analysis illustrates that among all the Machine Learning (ML) methods, the ANN method has emerged as the most frequently used across these studies. This prevalence highlights that the researchers adopted an ANN model, as it has the potential to capture temporal dependencies and non-linear hydrological interactions in flood-related datasets.
In addition, a few studies have employed deep learning approaches for forecasting flood events in diverse contexts. For instance, the studies like Chang et al. (2020) explored urban flooding, while Chand et al. (2025) investigated five flood-prone, specific study sites in Fiji. Similarly, Dtissibe et al. (2024) examined the Far-north region of Cameroon, particularly, the regions are generally physically based and produce unsatisfactory results. Obada et al. (2025) focused on the African context, while Kao et al. (2020) analyzed 12,216 hourly hydrological data collected from 23 typhoon events from the Shihmen reservoir catchment in Taiwan. Xiang et al. (2024) conducted their study in the Lushi basin in China, and Tan et al. (2023) predicted flow at the confluence between the Klang River and the Ampang River by using the historical rainfall data from 2008 to 2021 at 11 telemetry stations. Additionally, Chen et al. (2023) analyzed urban flood risk, and Roy et al. (2025) addressed the 22 flood-prone streets in Norfolk, Virginia.
An analysis of the literature revealed that among all the deep learning methods, the Long Short-term memory method is the most widely used for forecasting flood events. The Long Short-term Memory (LSTM) is adopted as an advanced Recurrent Neural Network (RNN) architecture, designed to address the problems of vanishing and exploding gradients that frequently occur during the training of traditional Recurrent Neural Networks (RNNs), particularly when long-term temporal dependencies are involved. LSTM architectures have demonstrated significant potential for modelling and forecasting river flood occurrences, which has led to their increasing use in time series forecasting in recent years.
3.2 RQ2. What statistical methods are used most effectively in flood forecasting?
As a group of literature, Wu, and Chau (2006) for the Yangtze River in China have employed the linear regression model (see Table 3). Khairuddi et al. (2019) for the river stream flow in the tropical environment have used both the linear regression model and root mean square error models. Similarly, Faruq et al. (2021) for the Kelantan River in Malaysia, Chang et al. (2020) for the urban flooding, Ahmed et al. (2022) for the Jhelum River, Punjab, Pakistan, and Chand et al. (2025) for the five flood-prone, specific study sites in Fiji have engaged in this research area. Moreover, Zakaria et al. (2021) analysed 10 years of hourly measurement Data of the Muda River’s water level in the northern part of Malaysia, while Tan et al. (2023) examined historical rainfall data from 2008 to 2021 at 11 telemetry stations were obtained to predict flow at the confluence between the Klang River and the Ampang River. In addition, Simmonds et al. (2024) for the Medio river, Roy et al. (2025) for the 22 flood-prone streets in Norfolk, Virginia, Samantaray et al. (2023) analyzed monthly river flow discharge for the period 1969 - 2018 of BP Ghat and Fulertal gauging sites from the Barak River flowing through Barak Valley in Assam, India, and Rostam-pour et al. (2025), Predicting the monthly streamflow of the Leaf River catchment, the United States has employed the root mean square error (RMSE) method in their analysis.
Table 3
Statistical methods used for flood forecasting
| SI No. | Author/Year | Units of the study | Statistical method | Input variable | Output Variables |
|---|---|---|---|---|---|
| 1. | Wu and Chau (2006) | The Yangtze River in China | LR | Water levels at the upstream station (Luo-Shan), with vario-us lead times (i.e., time-lagged inputs) | Water level at the down-stream station (Han-Kou) |
| 2. | Khairuddi et al. (2019) | River stream flow in the tropical environment | LR, RMSE | Water level, Rainfall data | Stream flow |
| 3. | Faruq et al. (2021) | The Kelantan River in Malaysia | RMSE | Water levels at four upstream stations in the river basin, time-lagged variables | Water level at a downstre-am station on the Kelantan River |
| 4. | Chang et al. (2020) | Urban flooding | RMSE | Rainfall hyetograph features, classified rainfall maps, and synthetic events | Inundated water depth,flo-od extent/maps, and flood occurrence. |
| 5. | Ahmed et al. (2022) | Jhelum River, Pun-jab, Pakistan | RMSE | Rainfall, temperature, eleva-tion, slope, land use, stream-flow data, soil moisture, and upstream water levels. | Flood level or river discharge/flow. |
| 6. | Chand et al. (2025) | Five flood-prone, specific study sites in Fiji | RMSE | Lagged values of SWRI24-HR-S | SWRI24-HR-S (Standardi-zed Water-Related Index, 24-hour scale, site-specific) |
| 7. | Zakaria et al. (2021) | Data of the Muda Ri-ver’s water, Malaysia | RMSE | River flow, rainfall, and past water levels | River water level |
| 8. | Tan et al. (2023) | Rainfall data from 2008 to 2021 Klang River and the Am-pang River. | RMSE, MAE, NSE | Historical rainfall data (2008–2021), Q(t): (Current or previous river flow | Q(t+0.5) (Forecasted River flow) |
| 9. | Simmonds et al. (2024) | Medio river | RMSE | Hourly Precipitation, Water Level | Streamflow or discharge |
| 10. | Roy et al. (2025) | 22 flood-prone streets in Norfolk, Virginia | RMSE, NSE, MAE | Rainfall, Tides, Elevation, Topographic Wetness Index (TWI), Depth-to-Water Table | Flood depth at street scale |
| 11. | Samantaray et al. (2023) | 1969 - 2018 of BP Ghat and Fulertal gauging sites, Barak Valley in Assam, India | RMSE, NSE | Precipitation (PT), Tempe-rature (TT), Solar Radiation (SR), Humidity (HT), Evapo-transpiration Loss (EL) | Monthly river flow dischar-ge (flood discharge) |
| 12. | Rostampour et al. (2025) | Monthly streamflow of the Leaf River catchment, the US | RMSE, NSE | Precipitation, Temperature, and Previous Streamflow Values | Monthly streamflow of the Leaf River catchment. |
| 13. | Agudelo et al. (2018) | Bogotá River, in Colombia | MAE, MSE | Water flow (discharge), Water level (stage), Precipitation (rainfall) | Flood levels or river stage/ discharge. |
| 14. | Yaseen et al. (2022) | The Hunza River in Pakistan | MAE, MSE | Sensor-based measurements collected along the Hunza Ri-ver over 31 years, in mounta-inous regions like Hunza) | Flood occurrence class (li-kely categorical, e.g., flood vs. no flood) |
| 15. | Jiang et al. (2022) | Regarding trends in flooding mechani-sms in Europe | Cluster analysis | Recent precipitation, ante-cedent precipitation (i.e., excessive soil moisture), and snowmelt | Annual maximum river discharge (flood peaks) |
| 16. | Malinovic-Milice-vic et al. (2023) | 20 flood events du-ring the period from October 2001 to December 2019, UK | Correlation analysis | Parameters of solar activity (Proton density, Differential proton flux (310–580 keV range), Ion temperature, solar wind parameters) | Precipitation |
| 17. | Huang and Lee (2023) | Real-time foreca-sting of urban floods | 1D SWMM | Rainfall intensity, duration, and pattern, elevation, slope, surface roughness, and Network relationships of the drainage system | Water levels, Water depths, or inundation levels on the street surface. |
Other studies, such as Roy et al. (2025), Samantaray et al. (2023), and Rostampour et al. (2025) have also used the Nash-Sutcliffe Efficiency model in their respective studies. Furthermore, studies like Agudelo et al. (2018) for the upper Bogotá River, in Colombia, between the Florence Bridge and the tocancipá hydrological stations, and Yaseen et al. (2022) for the Hunza River in Pakistan have used the Mean Absolute Error and Mean Squared Error statistical methods in their respective work. Additionally, some studies, such as Jiang et al. (2022) regarding trends in flooding mechanisms in Europe, Malinovic-Milicevic et al. (2023), who analyzed 20 flood events during the period from October 2001 to December 2019 in the UK, and Huang and Lee (2023) investigated real-time forecasting of urban floods have used cluster analysis, correlation analysis, and the 1D Storm Water Management Model in their work. This analysis revealed that the root mean square error (RMSE) method has been employed by authors more frequently in the context of flood forecasting. It reflects that the researchers have employed this method to check the reliability and acceptability of the following AI technology in the study. In other words, it is also used to check whether the data set is valid for the analysis, or not, in the following AI technique. The RMSE is widely used to evaluate the accuracy of flood forecasting models by estimating the average difference between observed and predicted values. However, it can reduce these errors and make those models more effective in hydrological forecasting (Moriasi et al., 2007; Chai & Draxler, 2014)
3.3 RQ3. Which keywords are frequently used by authors in artificial intelligence-based flood forecasting?
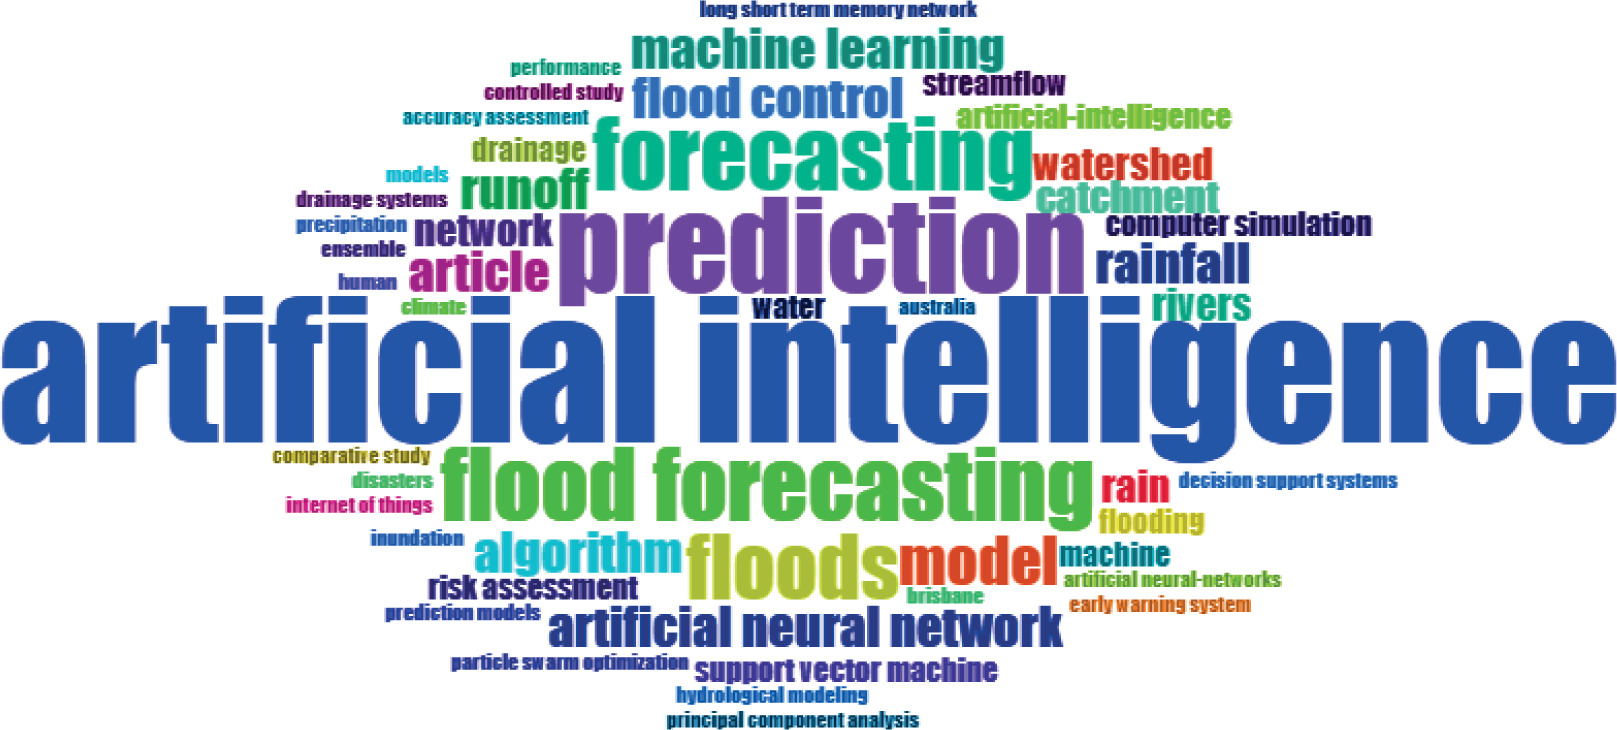
Keyword analysis is used to capture key hot issues and identify the research trends in a particular research field (Fu et al., 2013; Wang et al., 2014; Gao et al., 2015; Zhang et al., 2017; Lu et al., 2021). Figure 2 provides a word cloud to determine the most common terms repeatedly used by the authors for forecasting flood events by using artificial intelligence (AI). In other words, it shows how frequently the words appear. From this figure, it is observed that “artificial intelligence” is in the centre of the figure with a larger size, which reflects that most of the authors use this term more frequently. The terms like “prediction,” “flood forecasting,” “forecasting,” “floods,” “machine learning,” “artificial neural network,” and so on are more frequently used in the flood forecasting research area. This finding demonstrates a shift in research toward exploring whether AI-driven forecasting tools could strengthen community preparedness, enhance the decision-making process, and promote evidence-based policy interventions. Further, socio-economic factors also help increase households' adaptation to disasters (Patri, 2026).
4. Discussion
Following the PRISMA-2020 framework, this review summarizes the existing publications on the application of AI to forecast floods. The findings reveal that Artificial Neural Network (ANN) is the most frequently employed technique among various Machine Learning (ML) approaches for flood forecasting. The ANN model is used to simplify the complex relationships between explanatory and outcome variables without equations. Additionally, it can capture patterns and temporal dependencies from the longitudinal dataset, which makes them suitable for flood prediction. In contrast, the Long Short-Term Memory (LSTM) network method among deep learning (DL) approaches is highly equipped to demonstrate strong performance in time-series flood forecasting. However, the Root Mean Square Error (RMSE) is indicated as the most widely used evaluation metric across the reviewed studies. It underscores the importance of assessing model accuracy, reliability, and data sustainability.
Further, the word cloud demonstrates that terms such as “artificial intelligence,” “machine learning,” and “flood forecasting” are frequently used keywords, highlighting the growing recognition of AI tools as valuable components in flood forecasting and enhancing flood risk management. Overall, these findings emphasize the predominance of ANN and LSTM models in forecasting flood events. Additionally, it highlights the need to advance hybrid networks that integrate AI and statistical techniques to enhance model accuracy, interpretability, and practical applications.
4.1 Contribution of the study
The present study makes significant contributions to the existing literature on AI-based flood forecasting. Though previous studies provide valuable insight, they lack recent data coverage, methodological rigor, and a policy-oriented approach. Based on the extensive literature review, we found that previous review papers have specifically examined AI-driven technologies for flood forecasting, including machine learning, deep learning, and data-driven models, such as remote sensing and the Internet of Things. Furthermore, most of these studies have not highlighted the use of both AI algorithms and statistical methods within a single flood forecasting study. Therefore, this study aims to fill that gap by systematically analysing AI techniques and statistical methods using the PRISMA-2020 framework to predict flood events. The following subsections explain the contributions of this study in a detailed fashion.
4.1.1 Up-to-date and Complete Dataset
The majority of the earlier review papers on AI-based flood forecasting were conducted before 2022. As a result, they did not consider the latest techniques in deep learning (DL) and machine learning (ML). Therefore, to capture the most recent trends and advancing techniques, this study systematically examined the publications up to 2024. It offers an updated and forward-looking approach, which is not emphasized in the previous studies.
4.1.2 Implementation of the PRISMA-2020 Framework
This study rigorously adheres to the PRISMA-2020 framework, while earlier studies mainly employed narrative or systematic approaches. It ensures methodological transparency and reproducibility in the selection of the database, search criteria, data extraction, and synthesis. However, the use of both Scopus and Web of Science can help in removing duplicates and in reducing the selection bias of the database.
4.1.3 Comparative Analysis of DL and ML Models
Unlike previous studies that focused on AI models collectively, this study clearly distinguishes between two major AI techniques, such as Machine Learning (ML) and Deep Learning (DL). It emphasizes their strengths, weaknesses, and application scenarios. This study finds that the ANNs approach dominates in ML-based methods because of its readability and effectiveness with smaller datasets. Additionally, the LSTM technique is widely used in DL-based methods for its superior ability to capture temporal dependencies in time-series flood forecasting.
4.1.4 Combining Model Evaluation with Performance Metrics
This analysis has systematically measured the frequency and rationale for the use of assessment metrics, such as RMSE, MAE, and NSE. It emphasizes the supremacy of RMSE as an indicator of data validity and model accuracy, providing a comprehensive understanding of operational practices in the flood forecasting studies.
4.1.5 Thematic and Keyword Network Analysis
Using word cloud analysis, this study identifies evolving core themes and terminological transformation within AI-based flood forecasting. It reveals a paradigm change in flood risk management by underscoring a shift from traditional hydrological modelling to AI-driven predictive analytics.
4.1.6 Policy-focused Perspectives and Real-World Applications
Previous studies have focused exclusively on the technical aspects. In contrast, this study emphasizes the integration of real-time AI-driven flood forecasting techniques with national and local disaster management frameworks for better policy and governance implications. We have explicitly concentrated on how ML and DL tools can enhance preparedness, reduce socio-economic losses, and improve lead time for decision-making. Additionally, it offers practical and insightful suggestions to policymakers and disaster management authorities for effective mitigation of its impact.
Ultimately, our study suggests the development of hybrid models that combine traditional AI and statistical methods to strike a balance between accuracy, interpretability, and operational feasibility. This suggestion distinguishes our work from the earlier review papers, which specifically examined available AI models and ignored the integrational potential.
5. Conclusions with policy suggestions
Floods are the most frequent type of natural disaster among all types of disasters worldwide. Therefore, it is essential to adopt artificial intelligence (AI) techniques to address responses to flood disasters. The objective of this study is to conduct a systematic literature review (SLR) of flood forecasting using artificial intelligence (AI) techniques by the Preferred Reporting Items for Systematic Reviews and Meta-Analyses (PRISMA-2020) framework. Through the SLR, this study aims to address three research questions in this analysis, which are as follows: RQ1. Which artificial intelligence techniques are most commonly used in forecasting coastal flooding? RQ2. What statistical methods are most effectively utilized in flood forecasting? RQ3. Which keywords are frequently employed in artificial intelligence-based flood forecasting? This paper conducted a systematic literature review by collecting data from both Scopus and Web of Science databases using keywords such as “flood forecasting” and “artificial intelligence.” As a result, 101 research papers (including research articles and review papers) were extracted from both databases after applying all the exclusion and inclusion criteria. The RStudio software was used to merge the databases and eliminate duplicates. Following the removal of duplicate papers, 74 publications were converted into .xlsx formats for analysis using an Excel spreadsheet and Biblioshiny (a package of RStudio), respectively. Furthermore, 32 additional research papers were removed based on their abstracts. Ultimately, 42 publications were selected for the systematic literature review. The results indicate that most studies employed machine learning (ML) techniques, while a few used deep learning (DL) techniques for forecasting flood events. The Artificial Neural Network (ANN) and Long Short-Term Memory (LSTM) methods emerged as the most frequently used approaches among all ML and DL techniques.
Similarly, the study revealed that most of the studies have employed the root mean square error (RMSE) method more frequently in flood forecasting because it checks the reliability and acceptability of the AI technology used in those studies. The findings show that it is particularly well-suited for hydro-logical forecasting, as it effectively captures the most significant events.
In other words, it is also used to determine whether the data set is valid or fit for analysis. Keyword analysis shows that the term “artificial intelligence” has been used more frequently by the authors in this research area, followed by terms like “prediction,” “flood forecasting,” “forecasting,” “floods,” “machine learning,” and “artificial neural network.”
This study underscores the need for incorporating real-time AI-driven flood forecasting technologies, s pecifically ML and DL, into existing flood management frameworks. As a consequence, it enables more accurate and timely flood forecasting with a longer lead time. Subsequently, this lead time allows governments to take proactive measures to enhance disaster preparedness, optimize responses, and reduce socio-economic losses.
5.1 Limitations
This study exclusively focuses on highly used AI techniques for flood forecasting, but does not incorporate a comparative assessment with the traditional hydrological models. The review highlights that ANN and LSTM are highly employed models; however, the current study does not explore the rationale for their dominance. While the RMSE model is identified as the most frequently adopted evaluation metric, this study fails to evaluate other statistical performance indicators, including MAE, NSE, MSE, and R2, to standardize or normalize the results across studies. This study primarily concentrates on the AI-driven flood forecasting models. Therefore, it provides a scope for future research to examine their integration into policy frameworks, community preparedness programs, and cost-benefit assessments. This study includes only research articles, review papers, open-access papers, and English-language papers. It might restrict recent innovations and practical implications of AI approaches in the operational flood forecasting framework.
5.2 Future direction of research
Considering the above limitations, the present study suggests several avenues for further studies. Future studies should integrate hybrid AI techniques, transfer learning by integrating remote sensing with traditional hydrological models to enhance prediction accuracy, allowing more time to strengthen preparedness and reduce disaster risks. Moreover, this study suggests that future research could incorporate more databases, such as PubMed, Emerald, Wiley, and others, which provide a wider range of information. Additionally, future studies may consider different sources of literature, including book chapters, conference papers, books, and short surveys, which can offer valuable insights into the application of AI technologies in flood forecasting systems.