Introduction
FDI refers to the inflow of capital from a country outside the political boundaries of a nation. As per the Organisation for Economic Cooperation and Development (2009), FDI is characterised by a foreign investor’s ownership of 10% or more of the voting power in an enterprise. It is a vital driver of international economic integration since it creates stable links between nations. FDI propels economic growth, aids in employment generation, boosts human capital development, results in the spillover of technological advancements, and creates a competitive market. Before the economic liberalisation in 1991, FDI was severely restricted in India due to the trade protectionist policies emphasising self-reliance.
With the BOP (Balance of Payments) Crisis in 1991, the reforms introduced then increased the cap on foreign equity participation up to 51% in high-priority sectors such as electronics, machinery, and petrochemicals. It also introduced the automatic route for foreign investments, which improved the ease of doing business in India. State governments also attempted to attract FDI through policies such as tax holidays, development rebates, subsidised inputs, and providing public utilities at a lower price (Chatter-ji, 2019). The Make in India campaign, introduced in 2014, which aimed to transform India into a global manufacturing hub also attracted FDI inflows to the manufacturing sector. As a result, according to the Press Information Bureau or PIB (2024), since 2014, India has attracted a cumulative FDI inflow of USD 667.4 billion, registering an increase of 119% over the preceding decade (2004-14).
At the same time, it is worth considering that the remarkable growth in FDIs worldwide has also been accompanied by regional inequalities since several regions of a country typically do not receive FDI on an equal basis. A mutually reinforcing relationship is found to exist between FDI and growth (Bonassi et al., 2006), and in most plausible scenarios, FDI and inequality are positively correlated (Basu & Guariglia, 2007). Similarly, in India, it is observed that a few developed states such as Maharashtra, Gujarat, and Karnataka attract more FDI inflows, accentuating regional disparities. In contrast, foreign investors largely ignore the other regions. Sabharwal (2021), points out that states already rich in FDI receive more FDI, and Mukherjee (2011) states that this strong regional concentration deprives several states of the benefits of FDI. Sinha and Nayan (2017) statistically estimated that the concentration of FDI inflows in a few states is increasing at 2.4% per annum. This results in skewed economic growth, infrastructural development, social inequalities, and political instability. This unequal distribution can be associated with various historical, political, social, and economic factors.
Gajapathy and Chinchane (2021) stated that FDI inflows depend on macro and microeconomic, regional, institutional, and firm-level determinants. Sabharwal (2021) noted that the factors that influence skewed FDI include the size and growth of the local market, the level of industrial activity, the growth of the service sector, and the availability of quality physical infrastructure. While Gajapathy and Chin-chane (2021) specifically studied the location-specific determinants such as infrastructure, market size, openness of the economy, and economic stability. On the other hand, factors such as industrial linkages, labour conditions, policy environment, and agglomeration economies were used by Mukherjee (2011).Population is another factor, whereby a higher population indicates a growing workforce that allows corporations to pool talented and cheap labour (Benfratello & Nadimpalli, 2022). Research and development (R&D) efforts, domestic investment, transport and communication infrastructure, and educational infrastructure are other significant determinants (Chatterjee et al., 2013). Later, Mukherjee (2011) found that infrastructure, market size, agglomeration effect, and size of manufacturing base have a significant positive impact on the regional distribution of FDI flows in India. The correlation between higher economic growth and foreign direct investment was also found to be positive across India (Kayam et al., 2011).
However, most existing literature provides country-specific determinants of FDI inequalities, which cannot be used to study at a state level. The relatively few studies which explore the inter-state FDI inequalities in India identify the general factors determining the FDI inflows without offering selective, state-specific analyses. In particular, there is a lack of empirical research that compares a high-social-indicator state such as Kerala with the leading FDI-receiving states (Maharashtra, Karnataka, and Gujarat). Kerala has been chosen as the focal point of study because of its unique economic profile compared to other states, which is characterised by its well-developed social indicators and high reliance on remittances. Additionally, its distinct policy frameworks and governance structures which differ from the top FDI-receiving states make it a valuable case for exploring the structural factors limiting investment inflows. This contrast raises the question: Why does a state with advanced social development and human capital, such as Kerala, continue to experience comparatively low FDI inflows? The existing literature does not offer a cohesive understanding of how Kerala’s unique socio-political and economic profile and FDI inflows are linked. Hence, this study fills the gap by constructing a specific FDI Attractiveness Index which evaluates and compares the investment potential of Kerala with that of the top FDI-receiving states, thereby identifying areas for policy interventions and improvements.
Selection of Variables
According to the FDI statistics from DPIIT, the states that received the highest cumulative FDI equity inflows during October 2019-June 2024 were Maharashtra (US$ 77.57 billion), followed by Karnataka (US$ 53.31 billion), Gujarat (US$ 40.22 billion), Delhi (US$ 33.01 billion), and Tamil Nadu (US$ 11.93 billion). Hence, the dependent variable in this study is the state-wise FDI equity inflows. Equity inflows are a primary component of FDI and refer to the stakes or shares in companies bought by foreign investors. Figure 1 depicts the FDI disparity among the four Indian states.
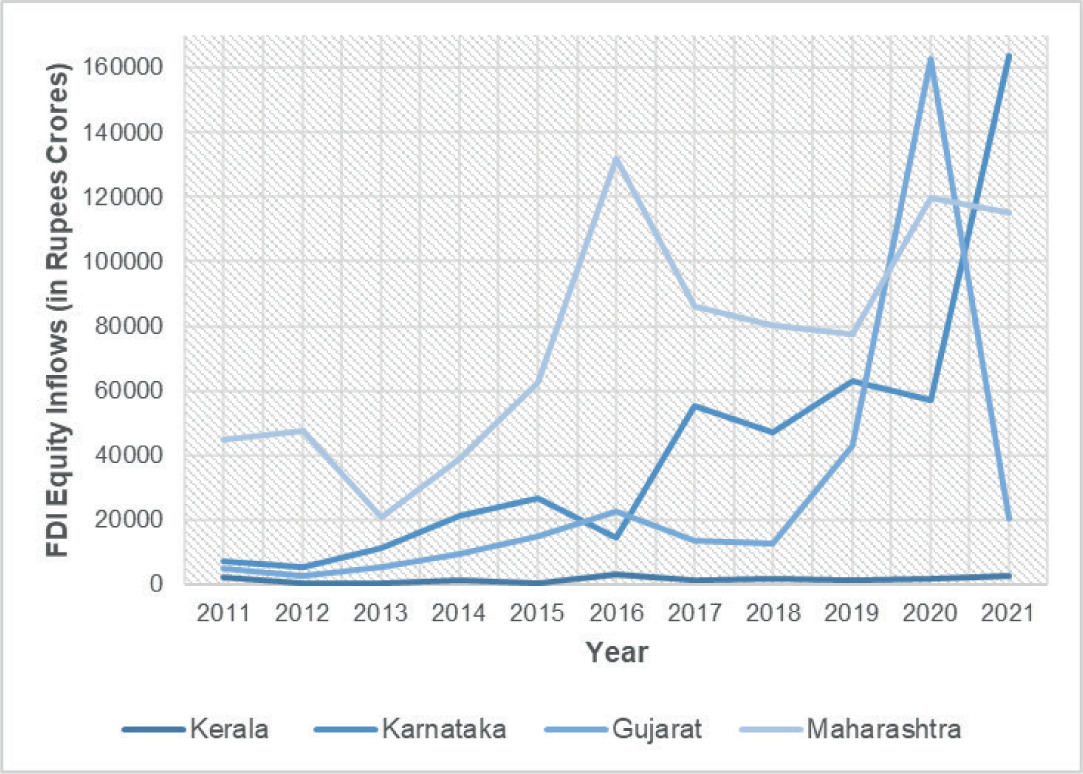
The study considers eight independent variables based on existing literature and theory. These eight variables have been grouped under five sub-groups: industrial activity, infrastructure, political factors, labour conditions, and demographic indicators. These variables have been selected carefully to fulfil the primary research objective of assessing the state-specific economic, political, and social factors contributing to interstate FDI disparity.
Industrial activity
Greater industrial activity can create a more attractive market for foreign investors, thereby increasing the FDI inflows to a state. Growing industrial activity is indicative of economic expansion and a rising consumer base. Additionally, industrial activity stimulates infrastructural development and technological advancements, other key determinants of FDI inflows. Two variables are considered to measure the industrial activity of the states involved – net state value added by economic activity – industry (at constant prices) (NSVA – Industry)1 and net state value added by economic activity – service (at constant prices) (NSVA – Service)2. NSVA – Industry refers to the total economic output generated by the industrial sector of a state adjusted for inflation to reflect real growth. Meanwhile, NSVA – Service refers to the total economic output generated by the service sector of a state adjusted for inflation to reflect real growth. The service sector is grouped under industrial activity, considering the service sector boom in several states. This is supported by P. Nunnenkamp and Stracke (2008), who pointed out a weakening relationship between FDI and a developed manufacturing base since FDI was shifting increasingly towards the services sector. It is assumed that states with higher NSVA – Industry and NSVA – Service have better infrastructure, skilled labour force, technological advancements, and greater innovation potential, making them attractive to investors.
Infrastructure
Infrastructure refers to the facilities and systems that aid in the smooth functioning of a market. Fundamentally, it includes physical infrastructure such as roads, railways, bridges, airports, warehouses, etc., and technological infrastructure such as telecommunication networks and digital platforms. Other types of infrastructure include social, financial, and human infrastructure. Infrastructural improvements enhance connectivity, improve market accessibility, increase the ease of doing business, and reduce the costs incurred. In this paper, infrastructure is represented by two indicators: the state-wise availability of power and the state-wise length of roads. The state-wise availability of power (in net crore units) refers to the total amount of electricity available for consumption in a state in a year. Whereas, state-wise length of road refers to the total road network in each state. State-wise railway route was another factor considered and later dropped since the 1980s India became a road-dominant economy and the railways had a declining share in both freight and passenger traffic (Chaudhury, 2005). It is expected that states with better infrastructure attract more significant FDI inflows.
Political factors
Political factors play a crucial role in either encouraging or discouraging FDI. These factors include political stability, government policies and regulations, bureaucratic efficiency, and government attitude toward FDI. Especially policies related to taxation, investment incentives, and trade tend to have a profound effect on FDI inflows. Due to the lack of available data concerning government tax policies, the variable state-wise primary deficit is chosen to represent political factors. It refers to the fiscal deficit of a state government, excluding the interest payments on previous borrowings. A well-managed primary deficit is indicative of good governance, policy stability, and room for government investment in infrastructure and other financial facilities. Fiscal prudence is thus related to political stability and effective leadership. Hence, state-wise primary deficit is more or less like an economic-political factor.
Labour conditions
Labour conditions refer to the working conditions of the labour force available, including wages, working hours, worker rights, and worker literacy rates. Low wages may attract FDI, while low labour productivity discourages FDI. A well-educated, skilled, and productive labour force draws in FDI inflows. Two variables are considered to measure the labour conditions of the states involved – wage rate and gross enrolment ratio. The wage rate in the states is taken as a measure of average labour cost per manday worked (in Rs.). On the other hand, the gross enrolment ratio (GER) was chosen as a proxy variable for literacy rate since the latter is a census variable. GER is an education measure of the total enrolment in a specific level of education. The gross enrolment ratio for classes I-VIII (6-13 years of age) was explicitly used for the same.
Demographic indicators
Demographic indicators are statistical measures of population characteristics, including urbanisation rate, life expectancy, fertility rate, birth rate, death rate, and population growth. They serve as social indicators of a country’s market potential. This paper uses the state-wise natural population growth rate to represent demographic indicators. Existing literature indicates a positive relationship between a country’s population and FDI inflows.
Significant inequalities can be observed among the above-mentioned socio-political-economic explanatory variables (see Appendix). In 2021, Kerala had the lowest natural population growth rate of 5.98%, while Gujarat had the highest growth rate of 13.58%. Maharashtra offered the highest average wage rate of Rs. 1427.26, and Gujarat the lowest with Rs. 1088.93. As of 2021, Maharashtra (7,06,137 km) has the best road connectivity among the four Indian states, followed by Karnataka (3,72,228 km). In terms of industrial activity, Gujarat has a booming industrial sector, and Maharashtra is at the forefront of the service sector.
Methodology
The chosen methodology to identify the relevant socio-political-economic determinants of state-wise FDI disparity is the random effects model (REM). This decision was based on the Hausman test to determine whether a fixed or random effects model should be used when analysing panel data, focusing on the relationship between individual effects and explanatory variables. The fixed effects model assumes individual traits influence the outcome and focuses on changes within each unit over time. On the other hand, the random effects model assumes individual traits are random and uncorrelated with variables, using both within- and between-unit variations.
In the context of the data set used, the random effects model is better suited since it accommodates both within-state (time variation among each state) and between-state (variation across the states) aspects to produce more efficient estimates. Secondly, the random effects model can effectively utilise the limited time dimension (T = 11 years), which might otherwise cause the fixed effects model to suffer. The REM model also provides greater generalizability, improving the model’s scope. Lastly, this model offers improved policy-making prospects due to its comprehensive advantages. For the reasons mentioned above, Chatterjee et al. (2013) and Kayam et al. (2011) have used the random effects model to compute the FDI inequalities among the Indian states. The REM equation used in this study can be specified as follows:
FDIit = β0 + β1 (NSVA-Industryit ) + β2 (NSVA-Serviceit ) + β3 (Powerit ) + β4 (Pdeficitit ) + β5 (Popit ) + β6 (Gerit ) + β7 (Wageit ) + β8 (Roadit ) + ui + ϵit
The variable names have been shortened to create a concise regression equation. Hence, FDI = state-wise FDI equity inflows, Power = state-wise availability of power, Pdeficit = state-wise primary deficit, Pop. = state-wise natural population growth rate, Ger = state-wise gross enrolment ratio, Wage = state-wise wage rate, and Road = state-wise road length. Here, ui represents the state-specific random effects, and ϵit is the idiosyncratic error term. On the other hand, the Principal Component Analysis (PCA) was employed for the FDI Attractiveness Index. This is because PCA reduces the variables into a smaller set of uncorrelated components, captures the shared variance among the variables, and eliminates multicollinearity.
Empirical Results
The empirical analysis is carried out in this paper using state-level panel data set from 2011-21 for the four states – Kerala, Karnataka, Gujarat, and Maharashtra. The annual state-wise FDI equity inflow data has been sourced from the Department for Promotion of Industry and Internal Trade (DPIIT), Ministry of Commerce and Industry, Government of India. Various other sources have been used to source data for the explanatory variables. Data on NSVA – Industry and NSVA – Service calculated with the base year 2011-12 have been obtained from the National Statistics Office, Ministry of Statistics and Programme Implementation (MoSPI), Government of India (GoI), and the Handbook of Statistics on Indian states published by the Reserve Bank of India. The annual state-wise availability of power and the state-wise length of road have been sourced from the Central Electricity Authority, Ministry of Power, and the Ministry of Road Transport and Highways, respectively. The variable used to represent labour conditions, including gross enrolment ratio (GER), was taken from the Economic Survey published by the Ministry of Finance, GoI. While the wage rate measured as the average labour cost per man-day worked was obtained from the Annual Survey of Industries (ASI), Labour Bureau. Lastly, the state-wise natural population growth rate data has been sourced from the Sample Registration Survey Bulletin, Census of India.
The estimation method used in this study is the random effects model, based on the Hausman test run (p-value: 0.9855 > 0.05). This p-value indicates that the random effects model is suitable for the data set since the differences in coefficients are not systematic. The Wald Test (test value = 76.28 and the associated p-value = 0.0000) run confirms that the overall model is sound and that the independent variables as a group are important determinants of state-wise FDI inflows. This model has an overall R-square value of 0.6855, indicating a good model fit. Table 1 provides the detailed random effects GLS regression results.
Table 1
The Random Effects GLS Regression Results
Table 1 shows that the signs of the estimated coefficients of most explanatory variables are in accordance with prior expectations. According to the model, NSVA – Industry is the most significant determinant of state-wise FDI inflows with a p-value of 0.007, which aligns with the idea that a strong industrial base attracts more FDI. As a result, Gujarat and Maharashtra, owing to their well-developed industrial sector, outperform the other two states in attracting FDI. NSVA – Service follows NSVA – Industry with a significance value of 0.025. This highlights the growing importance of the service sector. All four states offer varied services and have framed policies to propel their respective service sectors. Notably, Bangalore in Karnataka is a global hub for IT services, Kerala is known for tourism, and Maharashtra offers financial services. Amongst the four, Gujarat has the least service sector-driven economic activity, reflecting its secondary role in driving FDI in states that rely more on industries. Overall, industrial activity comprising both NSVA – Industry and NSVA – Service emerges as a key determinant of state-wise FDI inflows.
Surprisingly, the coefficients of the infrastructural variables, i.e. state-wise availability of power and state-wise road length, are negative. This is unexpected since we usually assume better power availability and road infrastructure attract more FDI. However, despite the negative coefficient, state-wise availability of power is statistically significant with a p-value of 0.026. Similarly, despite being a statistically significant determinant, primary deficit has a positive coefficient, which is against the a priori expectation. The other three remaining variables – gross enrolment ratio, wage rate, and natural population growth rate- are found to be statistically insignificant. Notably, the wage rate exhibits a negative correlation with FDI, affirming that higher wage rates deter FDI inflows, possibly due to increased costs for investors.
Diagnostic tests such as the Breusch-Pagan test, Woolridge Serial Correlation test, and VIF (Variation Inflation Factor) were additionally conducted on the model. The tests indicated that the model exhibited heteroskedasticity, prompting the use of robust standard errors as a corrective measure. After applying robust standard errors, it was determined that the state-wise primary deficit became insignificant, while all other factors remained unchanged. The model does not exhibit first-order autocorrelation and has a mean VIF value of 18.83.
To achieve the study’s second objective, Principal Component Analysis (PCA) was utilised to develop a data-specific FDI Attractiveness Index. For the same, all the previous eight variables were standardised to ensure that they were on the same scale. As mentioned in the ‘Selection of Variables’ section, the subgrouped variable heads with more than two variable components were combined using Principal Component Analysis (PCA). Specifically, the standardised variables for NSVA – Industry and NSVA – Service were merged to create a new variable called ‘industrial activity.’ Secondly, the standardised variables representing state-wise power availability and road length were combined to form ‘infrastructure.’ Lastly, the standardised variables for wage rate and gross enrolment ratio were consolidated into the variable ‘labour conditions.’ Thus, for the creation of the index, only five variables were considered – industrial activity, infrastructure, labour conditions, standardised state-wise primary deficit, and standardised state-wise natural population growth rate. The PCA run for the same is provided in Table 2.
Table 2
PCA of FDI Attractiveness Index
Since only those components with eigenvalues greater than one are considered significant, Comp1 (2.55171) and Comp2 (1.3876) (see Table 2) are the most relevant in explaining the variance in the data. Other components – Comp3, Comp4, and Comp5, are therefore not considered. Both industrial activity and infrastructure dominate Comp1 with positive loadings of 0.5805 and 0.5808, respectively. This suggests that states with robust industrial sectors and well-developed infrastructure tend to attract more FDI. Similarly, labour conditions exhibit a positive relationship (0.5108) in Comp1, indicating that favourable labour environments enhance FDI potential. Additionally, standardised state-wise primary deficit and standardised state-wise natural population growth rate have weaker positive contributions to Comp1. On the other hand, Comp2 shows a strong positive loading for population (0.6067) and a strong negative loading for primary deficit (0.1295). Therefore, Comp1 was chosen to generate the FDI Attractiveness Index since it has strong positive loadings for variables that are well-established determinants of FDI and explains 51.03% variance in the dataset.
The generated FDI Attractiveness Scale can be interpreted in this manner: Scores further away from 0 in the positive direction indicate higher FDI attractiveness, and scores further away from 0 in the negative direction indicate lower FDI attractiveness. While scores closer to 0 reflect a neutral or average level of attractiveness. It is a dynamic index that varies over time based on changes in economic policies, infrastructure development, industrial growth, and labour reforms. It also allows for comparing the four states’ relative performance in attracting FDI. Table 3 provides the FDI Attractiveness Index and the corresponding FDI equity inflows to the four states year-wise.
Table 3
FDI Attractiveness Index and Corresponding FDI Inflows per State and Year
Corresponding to Kerala’s low FDI inflows, the FDI Attractiveness scores for Kerala remain consistently the weakest among all the four states. However, Kerala’s scores show marginal progress from 2011 to 2021, reflecting the need for better measures to attract FDI. The low FDI attractiveness in Kerala can be mainly attributed to the lack of a significant industrial base. Though it has well-developed social indicators, its physical infrastructure may not meet the needs of large-scale industries. Additionally, as Mukherjee (2011) pointed out, the prevalence of strong labour unions and a large number of industrial disputes reflecting the pro-labour government policies in Kerala adversely affect the profitability of the manufacturers and the FDI inflows.
Karnataka, on the other hand, displays moderately positive FDI attractiveness scores. The state serves as India’s research and innovation hub and is home to many multinational companies and Research and Development (R&D) centres (Chhina, 2023). Particularly, Bangalore, the IT hub, also draws considerable FDI. Several policies adopted by the Government of Karnataka during the period of the study facilitated FDI inflows to the state including the establishment of the Karnataka Udyog Mitra, provision of Karnataka Industrial Tax concessions and capital investment subsidies, and establishment of the State High-Level Clearance Committee (SHLCC) and State-Level Single Window Clearance Committee (SLSWCC) (Kumar, 2024).
At the same time, Gujarat shows a steady shift from negative to positive values, demonstrating the state’s continuous improvements. Gujarat has a well-established industrial base that includes petrochemicals, textiles, cement, ceramics, etc. and is home to 20 functional Special Economic Zones (SEZs). Additionally, with the longest coastline in India, the state’s proximity to several operational ports, such as Mundra and Kandla, facilitates trade and attracts FDI inflows. The sector-specific policies announced by the State Government and the annual “Vibrant Gujarat Summit” since 2003 has also resulted in the FDI surge to Gujarat.
Lastly, Maharashtra has impressive attractiveness scores throughout the years. Mumbai, the financial capital of India, and Maharashtra, which houses major financial institutions, have attracted FDI inflows. Additionally, the state possesses a robust service and industrial sector, outstanding infrastructure, and ports such as Jawaharlal Nehru Port which enhances its export capabilities. The Industrial Policy, 2019 introduced by the Government of Maharashtra also increased FDI inflows to the state for instance through the set-up of Maharashtra Export Promotion Council to facilitate export promotion.
The FDI Attractiveness Index has not been subjected to further diagnostic tests because its scores exhibit a clear and consistent correlation with the state-wise FDI equity inflows. Higher inflows correspond to higher index values and vice-versa. This strong relationship indicates that the index effectively captures the variations in FDI inflows across states.
Conclusion
Based on the index developed and the Government of Kerala’s State Planning Board’s 14th Five-Year Plan (FYP) Report, a few recommendations that can enhance Kerala’s FDI attractiveness have been addressed below. Firstly, the state’s industrial sector is underdeveloped due to the absence of large manufacturing bases. This can be combated by promoting value-added industries such as spices and seafood processing industries, which would increase the state’s export potential, or by leveraging Kerala’s eco-conscious reputation to attract sustainable manufacturing firms. Improving labour dispute resolution mechanisms by establishing fast-track labour courts can also aid in labour-related challenges. Regarding infrastructure, the 14th FYP Report addresses the need to develop multimodal logistics hubs to facilitate trade. The overall ease of doing business can also be improved by simplifying the industrial land acquisition policies and organising regular investor summits. Additionally, establishing dedicated educational hubs can utilise Kerala’s high social indicators. Conducting international roadshows to highlight Kerala’s unique advantages and leveraging the large Malayali diaspora can further attract FDI inflows.
Thus, the study reveals a stark disparity in state-wise FDI inflows, with Kerala trailing behind Maharashtra, Karnataka, and Gujarat. Despite Kerala’s strong social indicators, such as literacy and health-care, its low FDI Attractiveness Index scores stem from a lack of industrial activity, infrastructural gaps, and labour-related challenges. These findings underscore the need for adopting a multifaceted approach to bridge the FDI gap and promote balanced regional development. By leveraging its unique strengths while addressing existing bottlenecks, Kerala can create a more conducive environment for investment.