Introduction
The European Union (EU) remains Türkiye’s largest trading partner. Since the Customs Union agreement took effect in 1996, the depth and volume of Türkiye’s economic integration with EU member states have significantly evolved. The trade liberalization facilitated by the Customs Union has effectively transitioned the Turkish economy from a state-controlled framework to a market-driven regime (Togan, 2012). Due to its strategic geographical location and high production potential, Türkiye has become an indispensable trade partner for the EU. The trade volume between Türkiye and EU countries currently exceeds 200 billion dollars. Furthermore, Türkiye serves as a vital hub in the EU’s supply chain and a regional production base. Similarly, the EU remains an essential market for Türkiye, with bilateral trade volumes continuing to grow. However, given factors such as income levels, population, geographic distance, institutional quality, and economic freedoms, the extent to which these mutual trade activities have reached their full potential remains an empirical question.
This study focuses on trade efficiency and potential trade between Türkiye and EU member states, aiming to determine Türkiye’s trade efficiency and trade potential with the 27 EU member states using the Stochastic Frontier Gravity Model (SFGM). While there is an extensive body of literature examining trade activities between Türkiye and the EU, this research distinguishes itself in several key aspects. Most notably, this is the first study to directly examine Türkiye’s total trade efficiency and potential with all its EU partners. By addressing this empirical question, the study offers a unique contribution and fills a significant gap in the existing literature.
Determining the extent to which Türkiye’s trade relations with its major partners approach their full potential is vital for the formulation and effective implementation of appropriate policies. Identifying the barriers to trade flows and uncovering markets with high unrealized potential play a pivotal role in achieving sustainable growth and development, particularly for an emerging economy like Türkiye that prioritizes export-led growth strategies. Rather than viewing the steadily increasing trade volume between Türkiye and the EU merely as a numerical expansion, the fundamental motivation of this study is to analyze these bilateral trade activities through the lenses of efficiency and potential.
A Brief Literature Review
This section focuses on empirical studies that examine trade flows within the framework of trade efficiency and potential, employing the Stochastic Frontier Gravity Model (SFGM) approach. Although there is an extensive body of literature regarding the traditional gravity model, studies utilizing the stochastic frontier approach remain relatively limited. The existing literature investigates trade efficiency and potential for total trade, both in the context of Türkiye and various other countries or country groups, while also extending these analyses to specific trade components. Recent and prominent studies in this field can be summarized as follows.
Empirical Evidence from Türkiye
Initial consideration is given to studies focusing specifically on Türkiye. Demir and Bilik (2018) investigated Türkiye’s trade potential with 31 trading partners using SFGM with panel data spanning the 2003-2014 period. Incorporating variables such as GDP, per capita income, distance, trade liberalization, population, and common customs unions, the study reported efficiency scores ranging from 11% to 96% for individual countries, with an overall average trade efficiency of 60%.
Similarly, Tuna et al. (2020) analyzed Türkiye’s foreign trade and potential with its top 20 export partners using the SFGM framework for the 2007-2017 period. Their findings highlight that while the economic size of the partner countries and Türkiye’s population positively influence trade, factors such as trade freedom indices of the partner countries and population of the partner countries, and geographical distance exert a negative impact. The average trade efficiency score for the selected country group was calculated at 68%. Aside from these studies, there is no research focusing directly on this specific methodology regarding Türkiye’s total trade; however, similar analyses exist for sub-export categories.
Global Perspectives and Regional Analyses
A comprehensive literature review reveals that SFGM-based analyses have been widely conducted for diverse country groups. For instance, Ravishankar and Stack (2014) utilized stochastic frontier analysis to test the trade integration potential between Eastern and Western European countries. Their results, based on panel data from 1994 to 2004, indicate a high degree of integration and low trade resistance between the two regions. Furthermore, Kumar and Prabhakar (2017) employed the SFGM approach to examine the role of Free Trade Agreements (FTAs) on India’s trade efficiency, concluding that India’s bilateral FTAs and its agreement with the ASEAN bloc significantly enhanced export and import efficiency, respectively.
In the context of East Asia, Lei and Li (2021) analyzed China’s bilateral trade efficiency with South Asian countries (2000-2019). The study asserts that China’s GDP growth does not contribute to the expansion of bilateral trade volume and that distance is no longer a factor hindering trade. They also noted high trade potential, though efficiency varied across countries. More recently, Khatir and Srivastava (2025) focused on intra-regional trade efficiency in South and Southeast Asian (SASEA) countries, observing a decline in bilateral technical efficiency over the last three decades. Their research emphasizes that while population negatively affects trade, shared religion, culture, and language serve as fundamental variables for higher trade performance.
Export-Specific and Sectoral Applications of SFGM
Furthermore, a distinct branch of the literature focuses exclusively on export flows rather than aggregate trade volumes when employing the SFGM approach. For instance, Deluna and Cruz (2013) concentrated on export potential and technical efficiency in the Philippines. Similarly, Noviyani et al. (2019) for Indonesia, and Obeng et al. (2023) for Ghana examined the determinants of export performance and bilateral efficiency using the stochastic frontier framework.
Beyond general exports, several studies narrow their scope to sub-sectoral categories, with agricultural products being the most prominent area of investigation. Indeed, an extensive body of literature specifically addresses agricultural trade; for example, Atif et al. (2017), Abdullahi et al. (2022), Romyen et al. (2023), Alizade et al. (2025), and Ghose et al. (2026) have utilized the SFGM approach to analyze the determinants, efficiency, and potential of agricultural exports across various country groups, including Pakistan, China, Thailand, Iran, and the USA, respectively. Additionally, recent empirical research has increasingly extended this methodology to evaluate the efficiency and potential of other specific export commodities.
Research Gap
In summary, while a substantial body of literature employs the SFGM approach to analyze total trade and sectoral exports, this review provides a concise synthesis due to the vast number of available studies. Although the broader gravity model literature concerning Türkiye is extensive, studies specifically utilizing the stochastic frontier approach to evaluate trade efficiency remain scarce. Notably, the lack of research investigating total trade efficiency and potential between Türkiye and the EU-its largest trading partner-represents a significant gap in the literature. Furthermore, this study distinguishes itself by covering a more extensive time period. Consequently, this research aims to fill these critical gaps, offering an original contribution to the existing
Data, Methodology & Findings
In this section, Türkiye’s foreign trade with EU countries is examined using the Stochastic Frontier Gravity approach with annual data for the 2002-2023 period. Within this scope, the primary determinants of Türkiye’s total foreign trade with the EU are first identified, followed by the construction of efficiency scores for each country. In the final stage, trade potential is calculated for each partner, and the total attainable trade volume between Türkiye and EU countries is estimated to determine the current trade gap.
The independent variables in the model were selected in accordance with the existing literature and theoretical frameworks. In this context, while the dependent variable consists of the total foreign trade volume, the independent variables are incorporated into the model in two groups: basic gravity model variables (lngdp, lndistance, lnpop, lndiffgdppc, contiguity) and trade inefficiency variables (lnreer, lnefi, lniqi). Additionally, the 2008 Global Financial Crisis and the Covid-19 pandemic, which had the potential to cause structural breaks in international trade activities during the period under study, were included as dummy variables. All series, except for the dummy variables, underwent logarithmic transformation. The variables used in the study, along with their descriptions and data sources, are presented in Table A1 in the Appendix.
The Gravity Model, inspired by Newton’s law of universal gravitation, is the most widely utilized empirical method for analyzing bilateral trade flows in the international literature. Tinbergen (1962) is recognized as the pioneer who first applied the gravity model to international trade, while Pöyhönen (1963) independently developed an early version of the model. Over time, the framework has evolved through significant contributions. Linnemann (1966) introduced variables such as population to create a more systematic structure, and Anderson (1979) transformed the gravity model from a purely empirical tool into a theoretical framework grounded in microeconomic foundations. Although this extensively preferred model incorporates measurable variables like GDP, population, and geographic distance to estimate trade flows at an average level, it tends to exclude critical inefficiency factors that may impede trade. Consequently, the traditional model struggles to measure inefficiencies arising from structural and institutional barriers, thereby complicating the estimation of trade efficiency and potential. To overcome this limitation, the Stochastic Frontier Gravity Model (SFGM) emerges as a highly robust alternative. Originally developed for production economics (Aigner et al. 1977; Meeusen & van Den Broeck, 1977). Stochastic Frontier Analysis has been adapted to the gravity framework in alignment with modern econometric standards (Kalirajan, 1999; Baldwin & Taglioni, 2006; Armstrong, 2007), establishing itself in the literature as a specialized tool for measuring trade efficiency and potential.
The conventional gravity model explains the drivers of trade between two countries based on GDP and distance, and is modeled as follows:
In this context, trade is a positive function of GDP and a negative function of distance. Although the conventional model has been extended over time with variables such as population, it lacks the capacity to measure inefficiencies in trade indicators. However, by integrating the stochastic frontier approach into the gravity model, a theoretical framework can be established that also measures potential trade (Kalirajan, 1999). In this model, known as the Stochastic Frontier Gravity Model (SFGM), the error term is composed of two distinct components: random errors and trade inefficiency. The model can be expressed as follows:
In this specification, Zij and Xijt represent the variables that determine trade flows. The terms vijt and uijt are the two-sided and one-sided error components, respectively. The vijt term accounts for the influence of measurement errors and other variables affecting trade flows that are beyond the control of the exporting country; it follows a normal distribution with a mean of zero (v ~ N (0, σv2))On the other hand, uijt represents unobservable institutional and political barriers that constrain trade. This one-sided error term reflects the combined effects of unobservable constraints on trade and defines the extent to which observed trade levels deviate from their maximum potential. This term is non-negative, and an increase in its value indicates that actual trade is deviating further from its potential. It follows a truncated half-normal distribution with a mean of µ and a variance of σ2u
The study employs the Maximum Likelihood Estimation (MLE) method, as adopted by Aigner et al. (1977), to estimate the SFGM. The estimated model can be specified as follows:
The Stochastic Frontier Gravity Model estimation results are presented in Table 1:
Table 1
. Stochastic Frontier Gravity Model Estimation Result
According to the estimation results, there are statistically significant positive relationships between Türkiye’s foreign trade with EU countries and Türkiye’s GDP and institutional quality index, as well as the population, real effective exchange rate, and economic freedom index of EU countries. Regarding other statistically significant variables, it is observed that the distance between Türkiye and EU countries (at a 10% significance level), Türkiye’s population, and the institutional quality index of EU countries negatively affect the total Türkiye-EU trade.
On the other hand, no statistically significant relationships were observed between Türkiye-EU foreign trade flows and the GDP of EU member states, the income gap between Türkiye and the EU (measured by GDP per capita differences), Türkiye’s real effective exchange rate, or its economic freedom index. Notably, the lack of a significant impact from the income divergence between Türkiye and EU countries suggests that no empirical evidence was found to support either the Heckscher-Ohlin Theory or the Linder Hypothesis. Furthermore, the analysis indicates that the existence of a common land border and the 2008 Global Financial Crisis did not lead to significant changes in total Türkiye-EU trade; however, the Covid-19 pandemic was found to have a positive impact on these bilateral trade relations.
Table 2
Diagnostic Tests for Stochastic Frontier Gravity Model
| Coefficient | Confidence Interval | ||
|---|---|---|---|
| Lower Bound | Upper Bound | ||
| σ2 | 0.3661009 | 0.100505 | 1.333565 |
| γ | 0.8359346 | 0.518645 | 0.960150 |
| Log Likelihood | -74.7491 | ||
| Prob > chi2 | 0.0000 | ||
The estimated σ2 parameter represents the total variance of the composite error term. The 95% confidence interval for σ2 excludes zero, indicating that the total variance of the composite error term is significantly different from zero and supporting the stochastic frontier specification. Similarly, the 95% confidence interval for the γ parameter also excludes zero. The estimated γ value of 0.836 indicates that approximately 83.6% of the total variance of the composite error term is attributable to technical inefficiency. The relatively high and statistically significant gamma coefficient provides strong evidence supporting the suitability of the stochastic frontier gravity model for the data. Finally, the Wald chi-square statistic (Prob > χ2 = 0.0000) indicates that the explanatory variables are jointly significant, confirming the overall statistical significance of the model.
Following the validation of the Stochastic Frontier Gravity approach, this stage of the study estimates the time-varying efficiency scores for Türkiye’s EU-member trading partners. Point estimates of technical efficiency can be measured using the formula of Battese and Coelli (1988), expressed as follows.
Where u*ijt = εijt - σv2 / σu, and Φ denotes the standard normal cumulative distribution functions. The efficiency values are calculated within the range of 0 to 1. A value approaching unity implies that the trade level is nearing its potential, whereas a value closer to zero indicates that actual trade is deviating from its potential. In this study, all efficiency scores have been computed based on the aforementioned formulation. The efficiency scores calculated for each country over the 2002-2023 period are shown in Table A2 in the Appendix.
The primary conclusion to be drawn from efficiency scores is the progressive increase in trade efficiency between Türkiye and EU member states over the years. Nevertheless, despite this upward trend, it is evident that foreign trade activities with many EU countries remain substantially below their potential levels. Specifically, with the exception of a few partners, trade activities with most EU countries still operate at less than 60% of their estimated potential. To investigate these dynamics more thoroughly, Figure 1 illustrates the efficiency scores for 2023. Following this, nominal trade potentials and emergent trade gaps were calculated for each country based on these scores and visualized in Figure 2 alongside actual trade figures. For further details, refer to Table A3 in the Appendix.
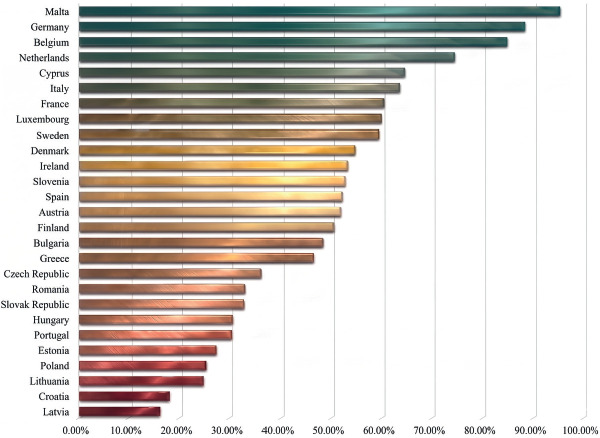
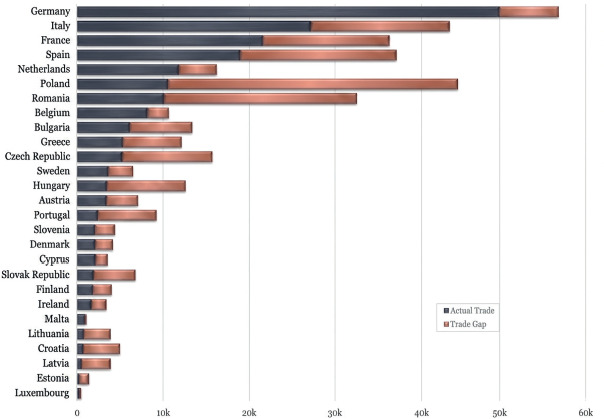
According to Figure 1 Malta emerges as the EU member state with which Türkiye achieved the highest trade efficiency in 2023. Based on the efficiency scores, the aggregate export and import activities between Türkiye and Malta reached 94.94% of their estimated potential. This exceptionally high ratio indicates that the potential trade between the two countries is being realized almost in its entirety. Malta is followed by Germany with an efficiency rate of 88.05%, Belgium at 84.57%, and the Netherlands at 74.25%, respectively. While these findings suggest that trade relations with these partners are operating close to their potential, a discernible trade gap nonetheless persists. On the other hand, it is evident that foreign trade activities between Türkiye and numerous EU member states are operating substantially below their potential. For instance, trade relations with Latvia reach only 15.79% of the estimated potential. Similarly, for many other countries, it can be stated that the achieved efficiency scores remain far from their potential levels. Figure 2 presents the actual trade and trade gap data for 2023, based on the trade efficiency scores for the same year. The sum of these two indicators represents trade potential.
Figure 2 ranks countries for the year 2023 in descending order, from the highest to the lowest trade volume with Türkiye. The most striking result here is that, despite the increasing trade volume, Türkiye possesses a significantly higher trade potential with EU member states. In particular, the trade gap values of the top-ranked countries with high trade volumes indicate a substantial potential in terms of volume that remains to be realized in these nations.
Discussion & Conclusion
This study examines the trade flows between Türkiye and the European Union (EU), its primary trading partner, for the period 2002-2023, utilizing a Stochastic Frontier Gravity Model approach. Beyond identifying the determinants of total trade between Türkiye and the EU, the research provides empirical data regarding trade efficiency and trade potential.
According to the findings, Türkiye’s GDP and institutional quality index exert statistically significant positive effects on trade flows with the EU. This confirms that bilateral trade is predicated not only on economic scale but also on institutional trust. Furthermore, the population of EU member states, the real effective exchange rate (REER), and the economic freedom index positively influence the total trade volume. Population growth in a country signifies an increase in demand; consequently, the rising population in EU countries is positively reflected in trade relations with Türkiye, which serves as an integral part of the EU production chain. An increase in the REER implies an appreciation of the national currency for EU members, which enhances their purchasing power and fosters a positive impact on total trade through export channels. Additionally, the economic freedom index represents trade liberalization; thus, an increase in economic freedoms can eliminate ‘invisible barriers’ to trade, leading to a positive outcome – a phenomenon interpreted as the effect of liberalization on international trade. Türkiye’s economic freedom index has not yet reached the levels observed in EU countries, which accounts for its statistically insignificant results within the model.
Conversely, the results indicate that Türkiye’s population, the institutional quality index of EU countries, and the geographical distance between partners tend to decrease trade. Although population growth theoretically implies a rise in demand, in a country with a vast population like Türkiye, which exceeds that of all individual EU member states, this outcome can be explained by the ‘absorption effect.’ As Türkiye’s population grows, increased domestic demand may prompt producers to satisfy internal markets rather than exporting abroad. Furthermore, such a large domestic market may enhance the tendency for import substitution, thereby narrowing imports and leading to a decline in total foreign trade volume. Finally, the negative coefficient of the EU’s institutional quality index can be attributed to the institutional misalignment between EU members and Türkiye. Since EU member states generally possess high institutional standards, the challenges faced by Turkish producers in meeting these stringent requirements are likely to lead to a contraction in trade volumes between the parties.
Distance, the fundamental indicator of the gravity model, now exerts a diminished impact on foreign trade compared to the past, thanks to the development of logistical capabilities. Various studies in the literature support this trend. In our study, the effect of distance was found to be negative at a 10% significance level. While this partially supports the aforementioned situation, it also indicates that distance remains a significant indicator in trade flows between Türkiye and the EU.
On the other hand, among the dummy variables included in the model, contiguity, the 2008 global crisis, and the COVID-19 pandemic, the contiguity and 2008 crisis variables were found to be statistically insignificant. In contrast, the COVID-19 pandemic was observed to have a positive impact on Türkiye-EU trade relations. This positive effect can be explained by the concept of ‘near-shoring.’ During the pandemic, the drastic rise in logistical costs for distant countries incentivized procurement strategies from nearby regions; consequently, trade between Türkiye and its EU neighbors was positively influenced by this shift.
Another primary objective of this study is to reveal the trade efficiency and trade potential between Türkiye and its EU trading partners. According to the findings, technical efficiency scores ranging from approximately 3% to 95% were achieved for the relevant countries and period. This suggests that trade efficiency between Türkiye and the EU fluctuates across a broad spectrum. Trade efficiency is relatively high with major economies such as Germany, Belgium, Italy, and France, reflecting well-established supply chains. Although higher efficiency scores are attained for these countries compared to some closer counterparts, these results underscore that these major economies are priority markets for Türkiye. Nevertheless, a substantial additional trade potential still exists. Lower technical efficiency scores in countries like Latvia, Croatia, and Lithuania indicate that structural and logistical barriers in these markets remain to be overcome. Conversely, Malta, positioned as a strategic logistical hub in the center of the Mediterranean, stands as an outlier; despite a low trade volume, nearly all of the potential trade between Türkiye and Malta is currently realized.
In conclusion, regardless of whether the total trade volume is small or large, it is evident that Türkiye’s trade potential with EU countries is remarkably high. According to the calculations performed in this study, despite a realized foreign trade volume of approximately $212 billion in 2023, an unrealized ‘trade gap’ of approximately $188 billion exists. Accordingly, the total trade potential between Türkiye and the EU is estimated to exceed $400 billion for the relevant year.
The identified trade potential between Türkiye and the EU clearly demonstrates that Türkiye must strengthen its trade relations with the EU and expand its foreign trade policies accordingly. Beyond calculating these numerical values, this study provides critical insights for policymakers by unveiling the determinants of trade. In this context, the study offers recommendations on three fundamental pillars. The first pertains to institutional quality; Türkiye should place greater emphasis on institutional quality in the coming period and prioritize reforms, particularly in areas such as the rule of law and bureaucratic efficiency. Another significant policy recommendation focuses on developing supplementary strategies for low-efficiency markets. It is evident that foreign trade volumes remain relatively low with Baltic and Eastern European countries, despite the substantial potential these regions hold. Prioritizing logistical infrastructure targeted at these regions could facilitate the realization of this untapped potential.
A further critical policy implication of this study concerns the Customs Union. The calculated trade efficiency and trade gap values indicate that foreign trade relations between Türkiye and EU member states remain far below their potential. This suggests that the Customs Union Agreement falls short of fully serving its intended purpose in the current climate. As the world undergoes rapid transformation, the modernization of the Customs Union Agreement to adapt to these evolving conditions should be a primary consideration for Türkiye.
As with all research, this study is subject to certain limitations. First, the analysis focuses on total trade (exports + imports) and does not provide a sectoral breakdown. Researchers wishing to explore the dynamics of different industries may adopt sectoral classifications to observe variations in efficiency across sectors. Furthermore, since this study was conducted specifically for countries within the Customs Union framework, customs duties and non-tariff barriers were not explicitly modeled. Future analyses focusing on different country groups would benefit from incorporating indicators such as quotas and customs duties into their models.
Appendix
Table A1
Dataset & Sources.
| Variable | Explanation | Source |
|---|---|---|
| lntradeTR-EU | Türkiye’s total trade with EU member country (export + import) (Log) | https://wits.worldbank.org/ |
| lngdpTR | Türkiye’s GDP (constant 2015 US$) (Log) | https://databank.worldbank.org/ |
| lngdpEU | EU member country’s GDP (constant 2015 US$) (Log) | https://databank.worldbank.org/ |
| lndistanceTR-EU | The distance between the economic centers of Türkiye and an EU member country (Log) | https://www.cepii.fr |
| lnpopTR | Türkiye’s total population (Log) | https://databank.worldbank.org/ |
| lnpopEU | EU member country’s total population (Log) | https://databank.worldbank.org/ |
| lndiffgdppcTR-EU | The difference between the GDP per capita of Türkiye and an EU member country (Absolute value) (Log) | https://databank.worldbank.org/ |
| lnreerTR | Türkiye’s CPI-based Real Effective Exchange Rate (2025=100) compared to Developed Countries (Log) | https://evds3.tcmb.gov.tr |
| lnreerEU | EU member country’s real effective exchange rate - index, 42 tra-ding partners (Log) | https://ec.europa.eu/eurostat/ |
| lnefiTR | Türkiye’s economic freedom index (Log) | https://economicfreedom.heritage.org |
| lnefiEU | EU member country’s economic freedom index (Log) | https://economicfreedom.heritage.org |
| lniqiTR | Türkiye’s institutional quality index* (Log) | https://databank.worldbank.org/ |
| lniqiEU | EU member country’s institutional quality index* (Log) | https://databank.worldbank.org/ |
| contiguity_dummy | Land border between Türkiye and an EU member country (Yes:1, No:0) | |
| 2008_dummy | 2008 Global Crisis | |
| covid19_dummy | Covid-19 Pandemic |
* The institutional quality index was created by the author using principal component analysis with indicators such as Control of Corruption, Political Stability, Government Effectiveness, Regulatory Quality, Rule of Law, Voice, and Accountability, obtained from the World Bank database.
Source: author’s analysis.
Table A2
Türkiye’s Technical Efficiency Scores with EU Countries by Year, 2002-2023.
Table A3
Actual Trade, Trade Potential & Trade Gap by Country, 2023.