1. Introduction
1.1 Background of the Study
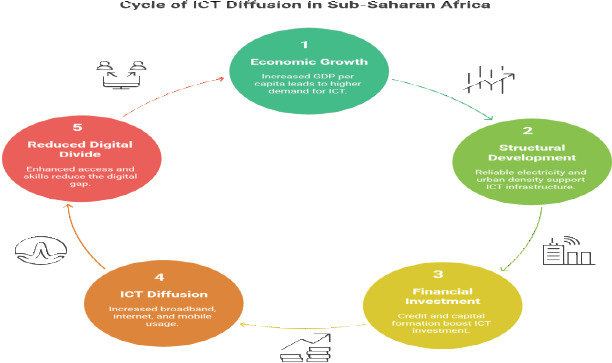
Information and communication technologies (ICT) are becoming more and more crucial to the digital transformation of economies. ICT diffusion includes the widespread and effective use of digital devices, internet connectivity, mobile phones, broadband infrastructure, and associated services across societies (Jagannath, et al., 2018). The diverse proliferation of ICT is influenced by the constraints of material access (infrastructure availability), economic access (affordability), skills access (digital liter-acy), and usage access (meaningful use of technology). Together, these components define the extent of the digital divide, which is defined as disparities in access to and competence with ICT infrastructure (Jagannath, et al., 2018).
Sub-Saharan Africa (SSA) presents a distinctive digital landscape with its cutting-edge digital finan-cial ecosystems, expanding internet connectivity, and quick mobile adoption. But it is also constrained by persistent inadequacies in infrastructure, problems with affordability, and unequal access to electric-ity and financing (Roger et al., 2022; Ofori et al., 2021). Although mobile phone and internet usage has increased dramatically and often surpasses traditional fixed-line infrastructure, ICT diffusion in SSA remains uneven and falls short of international standards (Bello et al., 2024; Beyene et al., 2024). Beyond technological concerns, bridging the digital divide is a developmental imperative linked to financial in-clusion, inclusive growth, healthcare delivery, education, and resilience to climate and economic shocks. Understanding the elements that affect ICT diffusion is therefore necessary to develop strategies that support equitable digital transformation across the region.
An empirical study indicates that economic prosperity, which is frequently gauged by GDP per cap-ita, is one of the primary factors influencing the adoption of ICT. Across countries, there is consistently a positive and statistically significant correlation between income levels and ICT penetration as mea-sured by internet use, broadband access, and mobile subscriptions (Baliamoune-Lutz, 2003; Lee et al., 2011). In SSA, similar patterns are evident: Myovella et al., (2021), find a strong correlation between digitalization and GDP per capita in 41 countries, and micro-level research in West Africa indicates that consumption expenditure is a powerful predictor of mobile internet adoption (Hasbi & Dubus, 2020; Cas-telan, 2021). However, income has a conditional effect; its impact is lessened by complementary factors such as the standard of the infrastructure, the effectiveness of the laws, and the growth of human capital (Kouladoum, 2023; (Teklemariam & Kwon, 2020). This highlights the fact that economic growth on its own cannot drive digital inclusion in the absence of institutional and structural support.
One of the most important prerequisites for digital connectivity among these enablers is energy availability. Electrification facilitates the growth of digital networks and the operation of ICT devices. Empirical data from emerging nations shows that having access to electricity significantly increases smartphone ownership, mobile connectivity, and digital involvement, especially among women and rural people (Armey & Hosman, 2016; Owolabi et al., 2023) However, energy access does not guarantee digital participation on its own; it is influenced by price, reliability, and coverage (Houngbonon & Quentrec, 2019). Therefore, initiatives to lower energy costs and increase digital literacy must be combined with investments in rural electrification to achieve sustained ICT diffusion.
Similar to this, the financial industry plays a complex yet vital role in promoting the spread of ICT. Businesses and individuals can invest more in digital infrastructure, services, and devices thanks to domestic credit to the private sector (DCPS). Despite global evidence of a correlation between ICT and financial development, the findings from SSA are more nuanced. Other studies find insignificant or con-ditional effects (Owolabi et al., 2023; Ihayere et al., 2020), while some research suggests a two-way caus-al relationship between financial depth and internet use (Owusu-Agyei et al., 2020). Inadequate credit availability, underdeveloped financial markets, and crowding out from public borrowing are structural barriers that prevent the sector from promoting digital growth (Alimi & Adediran, 2020; Verma et al., 2023). Therefore, policies aimed at developing financial systems must concurrently strengthen institu-tional and macroeconomic frameworks in order to capitalize on synergies between finance and ICT.
Gross fixed capital formation (GFCF), which is a measure of total investment, is another significant factor, though it varies depending on the situation. Although GFCF is commonly used to represent real investment, it may obscure certain investments in telecommunications and digital infrastructure due to its broad range of non-ICT sectors. Significant advantages for digital expansion are revealed by research using investment indicators that are either disaggregated or specific to ICTs (E et al., 2023; Nchake & Shuaibu, 2022). Research that uses aggregate GFCF often yields contradictory results, indicating that investment quality rather than just quantity determines ICT outcomes (Ofori & Asongu, 2021; Owolabi et al., 2023). This realization further supports the need to strategically allocate funds for ICT infrastruc-ture, particularly in underserved rural areas.
Urbanization also serves as a spatial amplifier of ICT expansion since it concentrates consumer de-mand, skilled labor, and infrastructure. Urban agglomerations generate economies of scale that acceler-ate the diffusion of technology (Sapienza et al., 2023). Empirical evidence indicates that urban SSA fam-ilies and businesses have significantly higher ICT adoption rates than rural ones (Odusanya & Adetutu, 2020; Girollet, 2024). This urban advantage could, however, reinforce spatial inequality unless strong measures for rural connectivity are put in place. On the plus side, recent studies indicate that prioritizing policies for infrastructure affordability and expansion reduces the urban-rural digital divide, suggesting the potential for inclusive digital convergence (Fei et al., 2024).
Several research gaps remain despite these advancements. ICT diffusion factors are often examined in isolation or in conjunction with a limited number of indicators in previous studies (Myovella et al., 2021; Ofori et al., 2022; Asongu & Biekpe, 2017). In order to manage endogeneity and dynamic interac-tions, few studies have integrated financial, structural, and economic components into a single analytical paradigm. By analysing the relationships between GDP per capita, capital formation, electricity access, domestic credit, and urbanization, a more complete understanding of the factors influencing the spread of ICT can be achieved. In a similar vein, while the governance and geographic elements have been ex-amined Buys et al., (2009) and Asongu & Biekpe, (2017), little is understood about the dynamic causal mechanisms underlying how these elements interact in the context of SSA.
The current study fills these gaps by using Principal Component Analysis (PCA) to develop a com-posite ICT diffusion index that incorporates nine significant dimensions (e.g., secure server density, mo-bile usage, broadband subscriptions, and internet access). A balanced panel of 37 SSA nations is then subjected to a two-step System Generalized Method of Moments (GMM) estimator from 2012 to 2022. This approach enables a comprehensive examination of the causal and dynamic relationships among ICT diffusion, economic structure, and financial depth by mitigating endogeneity and unobserved heteroge-neity biases. Thus, the study contributes to the empirical and policy discourse on digital transformation by offering a thorough framework for understanding and speeding up ICT dissemination in Sub-Saharan Africa.
1.2 Hypothesis
Based on theoretical insights and empirical data from the literature on ICT diffusion, this study for-mulates five testable hypotheses regarding the factors influencing ICT adoption in Sub-Saharan Africa (SSA).Diffusion theory (Rogers, 2003), endogenous growth frameworks, and recent empirical research that is specific to low-income and SSA situations all lend credence to these theories.
✓ H1: GDP per capita has a positive and significant impact on ICT diffusion in SSA.
✓ H2: The availability of electricity has a positive and significant impact on the diffusion of ICT.
✓ H3: Domestic credit to the private sector (DCPS) indicates that the development of the financial sector has a significant impact on the dissemination of ICT.
✓ H4: (GFCF) have a significant impact on ICT dissemination.
✓ H5: There is a significant correlation between ICT diffusion and urbanization in SSA.
2. Theoretical and Empirical Literature Reviews
2.1 Theoretical Literature Reviews
Understanding the factors influencing the spread of information and communication technology (ICT) in Sub-Saharan Africa (SSA) requires a basis in established theoretical frameworks that explain how and why technologies spread across populations and economies. This study draws from three pri-mary theoretical frameworks: diffusion of innovations theory, endogenous growth theory, and new eco-nomic geography. Together, these provide a solid conceptual foundation for investigating the ways in which urbanization, financial development, infrastructure, money, and investment impact ICT adoption patterns in low-income, structurally constrained environments.
2.1.1 Diffusion of Innovations Theory
Rogers, (1983), seminal Diffusion of Innovations theory states that the adoption of new technologies follows an S-shaped curve. Five key elements of the innovation itself relative advantage, compatibility, complexity, trialability, and observability as well as adopter traits and communication channels all have an impact on this curve. Since it increases one’s ability to buy tools, data, and services, income as indicat-ed by GDP per capita is a crucial component in enabling “relative advantage” in the context of ICT.
Rogers also emphasizes that infrastructure and social structures serve as intermediaries in the spread process, which is not exclusively influenced by demand. This insight aligns with research in Sub-Saharan Africa (SSA), where a lack of electricity and network coverage prevents even affordable mobile technologies from becoming widely used. While income creates the foundation for adoption capa-bility, complementary enablers such as energy availability and internet literacy are essential to overcome complexity and compatibility barriers, especially in rural or underprivileged groups.
2.1.2 Endogenous Growth Theory
Romer, (1990) and Aghion, et a., (1992) , are two examples of endogenous growth models that pres-ent technological advancement as an internal engine of long-term economic growth propelled by invest-ments in human capital, knowledge, and physical infrastructure. This paradigm views ICT as more than just a consumer good; it is a form of knowledge-based capital that stimulates innovation, increases pro-ductivity, and creates positive externalities. Consequently, the growth process depends on investments in ICT infrastructure, whether made with public funds or private capital formation. Nevertheless, the effectiveness of such an investment depends on absorptive capacity, which is impacted by institutional quality, human capital, and financial depth. Domestic credit to the private sector (DCPS), a stand-in for the development of the financial sector, facilitates the acquisition of funds for ICT adoption by households and businesses as well as the acquisition of funds for network expansion by telecom operators and digital enterprises. Without further reforms, the theoretical link between ICT diffusion and financial develop-ment may be undermined in SSA, where credit markets are often shallow and fragmented.
2.1.3 The New Economic Geography and Agglomeration Economies
The new economic geography literature Fujita & Krugman, (2004), explains spatial differences in economic activity through a process known as agglomeration effects, in which people and businesses gather in metropolitan areas to benefit from shared infrastructure, labour pools, and knowledge spill-overs. By concentrating demand, reducing deployment costs per user, and fostering ecosystems of digital service providers, urbanization accelerates the adoption of digital technology, according to this theory. As a result, cities become “adoption hotspots,” where network effects and economies of scale lower the marginal cost of connectivity and increase the advantages of digital engagement. However, this same dynamic may exacerbate the digital divide between rural and urban areas unless deliberate policy in-terventions such as rural broadband mandates, universal service grants, or public-private partnerships extend infrastructure and affordability to peripheral regions. The theory suggests that there would be a strong positive correlation between urbanization and the spread of ICT, but it also highlights the need for spatially inclusive policies to ensure equitable access.
According to these three theoretical frameworks, the spread of ICT is a complex phenomenon that is impacted by the interaction of financial intermediation (credit), capital allocation (investment), economic capacity (income), physical infrastructure (electricity), and spatial concentration (urbanization). The process isn’t strictly economic or linear. Crucially, none of these components work by it-self. For instance, if investment is directed toward ICT-specific assets, financial development can lower adoption barriers; urbanization promotes diffusion but may solidify spatial inequality if targeted rural strategies are not put in place; and income generates demand but it stays dormant in the absence of electricity. This integra-tive viewpoint informs the empirical specification of this work, which models ICT diffusion as a dynamic process driven concurrently by these interdependent variables.
This study improves our knowledge of the structural and systemic elements that either facilitate or obstruct digital inclusion in SSA by laying the analysis on these well-established theoretical traditions. It also provides a conceptual road map for evidence-based policy design.
2.2 Empirical Literature Reviews
A substantial body of empirical research looks at the factors that affect the spread of ICT, with a growing emphasis on the unique institutional and structural context of Sub-Saharan Africa (SSA). This section summarizes peer-reviewed research on five important factors: GDP per capita, gross fixed cap-ital formation (GFCF), access to electricity, domestic credit to the private sector (DCPS), and rbanize-tion. Results from SSA-specific analyses are prioritized, but international studies are consulted when appropriate. Each component provides the framework for the review, which emphasizes important find-ings, methodological approaches, and contextual information that affect the current study’s empirical approach.
2.2.1 GDP per Capita and ICT Diffusion
Income, which is typically expressed as GDP per capita, is one of the most commonly, mentioned factors affecting the worldwide adoption of ICT. Baliamoune-Lutz, (2003), finds in a ground-breaking cross-country study of developing nations that a higher GDP per capita significantly accelerates the pro-liferation of computers, mobile phones, and internet users. This is corroborated for OECD countries by (Lee et al., 2011), who show that, due to differences in cost and infrastructure intensity, money has a more positive effect on fixed broadband than on mobile broadband. Stage-dependent analyses further refine this link: (Aivazidi & Michalakelis, 2022) , demonstrate that GDP per capita is more significant during later dissemination stages once basic infrastructure and affordability requirements are met.
In SSA, this pattern holds true for all analytical scales. Myovella et al., (2021), use a spatial Durbin model for 41 SSA countries and find that GDP per capita is positively and strongly correlated with na-tional digitalization, although the effects vary by region due to cross-border spillovers. In West Afri-ca, household consumption expenditure is a strong micro-level predictor of mobile internet uptake, as demonstrated by (Giangregorio & Menés, 2024; Hasbi & Dubus, 2020). However, the income effect is often conditional. GDP per capita alone is insufficient without additional enablers like power, digital literacy, and high-quality regulations, according to (Kouladoum, 2023; Beyene et al., 2024).
2.2.2 Electricity Access as a Foundational Enabler
Access to reliable energy is increasingly recognized as a prerequisite for ICT use, especially in low-in-come and rural areas. Armey & Hosman, (2016), show that power is a requirement for ICT adoption in low-income countries using satellite nightlights and cross-country panel data. Senegal’s high-resolution micro evidence backs up their conclusions: Electrification in rural areas significantly increases smart-phone ownership, mobile connectivity, and digital engagement, with particularly large gains for women and households that receive calls from urban areas, according to Houngbonon & Quentrec, (2019), using mobile call detail records (CDRs).
SSA panel research supports these findings. According to Owolabi et al., (2023)fixed line telephone, Information and Communications Technology good imports, internet, mobile, and secure internet serv-ers, and financial development measured by private sector domestic credit to GDP on economic diver-sification as measured by a computed Herfindahl–Hirschman Index of economic diversification. Model estimation was performed using pooled ordinary least squares regression, panel data fixed effects re-gression, and generalized method of moments regression. The results from findings indicated that the Information and Communications Technology variables: fixed-line telephone, and ICT imports ignify-cantly reduced economic diversification, while internet and mobile were, respectively, insignificant for boosting economic diversification, and fixed broadband and secure internet servers were insignificant in adversely affecting economic diversification. As regards financial development, it was insignificant in boosting economic diversification of sub-Saharan Africa countries. The study recommended amongst others that individuals in sub-Saharan Africa countries should have improved access to Information and Communications Technology infrastructure and governments should ensure adequate provision of quality Information and Communications Technology infrastructure.”,”container-title”:”Journal of Eco-nomic Structures”,”DOI”:”10.1186/s40008-023-00299-7”,”ISSN”:”2193-2409”,”issue”:”1”,”journalAbbre-viation”:”Economic Structures”,”language”:”en”,”page”:”5”,”source”:”DOI.org (Crossref, who used instru-mental variable approaches in 16 West African countries, power access accurately predicts both mobile and internet usage in first-stage regressions. Beyene et al., (2024), also find that electricity is a statisti-cally significant factor in the development of digital technologies in a 16-country SSA panel. Nonetheless, scholars consistently caution that electricity is insufficient and that its impact is contingent upon various factors, including digital proficiency, network coverage, and the affordability of devices (Houngbonon & Quentrec, 2019; Salat et al., 2021).
2.2.3 Financial Development and ICT: A Conditional Nexus
In SSA, there is a theoretically reciprocal but practically contradictory relationship between ICT diffusion and financial sector development, which is commonly measured by DCPS. International stud-ies often report on reinforcing feedback loops. For instance, Verma et al., (2023) and Alimi & Adediran, (2020) demonstrate a two-way causal relationship between ICT dissemination and financial depth, sug-gesting beneficial cycles of digital and financial inclusion. However, the SSA evidence is more nuanced. Owusu-Agyei et al., (2020) , show that internet adoption and financial growth are causally related in both directions in 42 SSA countries, with DCPS significantly predicting internet uptake in certain criteria. However, DCPS is often ineffective or only partially effective in promoting the spread of ICT (Ihayere et al., 2020; Owolabi et al., 2023). This variability reflects some of the basic problems with SSA's finan-cial systems, including limited loan availability for consumers and SMEs, fiscal crowding-out by public borrowing, and shallow capital markets (Kouladoum, 2023). When positive results are observed, they usually operate through digital finance channels, such as mobile money, that get around the restrictions of traditional banking (Sanga & Aziakpono, 2022; Teklemariam & Kwon, 2020).
2.3.4 Investment Quality over Quantity
Aggregate GFCF is a widely used but problematic proxy for ICT-enabling investment. Studies that use perpetual inventory methods (PIM) or direct infrastructure proxies to break down GFCF into ICT-specif-ic components have a positive effect on digital dissemination. By creating ICT capital services using dis-aggregated Chinese investment data, E et al., (2023), for instance, show a significant positive contribution to digital outcomes. However, SSA panel analyses using undifferentiated GFCF report mixed or negligible direct consequences. Ofori & Asongu, (2021) and Owolabi et al., (2023), treat GFCF as a macro-control and conclude that it is not a reliable indicator of ICT dissemination. They point out that non-ICT investments (like those in housing or roads) dilute the signal. An important solution is offered by Nchake & Shuaibu, (2022), who use system GMM on a 46-country African panel to show that ICT infrastructure investment, rather than aggregate GFCF, robustly boosts inclusive development and, implicitly, ICT uptake. This is in line with micro-level data showing that targeted telecom CAPEX, not general capital formation, is what drives adoption (Bertschek & Niebel, 2016).
2.2.5 Urbanization as a Spatial Amplifier
It is commonly demonstrated that urbanization is a powerful catalyst for the proliferation of ICT. Sapienza et al., (2023), show that exposure to urban areas triggers a causal increase in daily smartphone use and diversifies app engagement through quasi-experimental variation in individual mobility across urban–rural boundaries. According to Odusanya & Adetutu, (2020), Nigerian households in urban areas are significantly more likely to use the internet due to better network coverage and electricity, even after controlling for income and education. In a similar vein, Girollet, (2024) ,report that microenterprises in urban SSA regions exhibit superior digital tool adoption.
However, macro-level studies reveal heterogeneity. Myovella et al., (2021), claim that the rbanize-tion effect varies spatially within SSA due to differences in infrastructure and governance. According to Park, (2025), urbanization is linked to faster mobile dissemination in many SSA countries; however, the significance and magnitude of this relationship vary depending on sub-regional institutional and cultural circumstances. Importantly, recent data suggests that the gap between urban and rural areas is narrow-ing in places where proactive policies are implemented, like affordability subsidies and rural broadband requirements Fei et al., (2024), highlighting the potential for inclusive convergence.
Economic, infrastructural, financial, and spatial factors that affect ICT diffusion in SSA are all con-verging, according to empirical research. GDP per capita creates the demand-side foundation and urban-ization provides agglomeration benefits, but the effectiveness of these factors depends on the quality of investment, the depth of financial markets, and the availability of power. Importantly, many recent studies on SSA either rely on aggregate proxies (e.g., undifferentiated GFCF or DCPS) or ignore sectorial subtleties by looking at these factors separately. Furthermore, dynamic panel methods that adequately address persistence, endogeneity, and reverse causality are not commonly employed.
This study fills these gaps by estimating a system GMM model on a balanced panel of 37 SSA nations from 2012 to 2022. At the same time, it examines how a composite ICT diffusion index is affected by the interdependent factors of urbanization, DCPS, GFCF, GDP per capita, and power access. This gives us a more thorough, policy-relevant understanding of the structural levers that can be used to speed up the region’s digital inclusion.
3. Methodology
3.1 Research Design
This study employs a quantitative panel-data research approach to empirically investigate the eco-nomic, financial and structural factors that impact ICT diffusion across 37 Sub-Saharan African (SSA) countries between 2012 and 2022. Panel data enable more accurate estimation by accounting for coun-try-specific variability and temporal dynamics (Baltagi., 2021). The method is appropriate for studying long-term developmental patterns since it corrects for measurement error, takes into consideration un-observed variability, and identifies the causal processes in macroeconomic connections.
3.2 Construction of the ICT Diffusion Index
The dependent variable is a composite ICT Diffusion Index consisting of nine ICT variables that encompass both infrastructure and access aspects. These measures, which are derived from the World Development Indicators, act as international benchmarks for digital readiness (World Bank, 2023b).
The index is computed using Principal Component Analysis (PCA), which is consistent with ICT studies (Ofori & Asongu, 2021; Bello et al., 2022; Roger et al., 2022; Beyene et al., 2024) that argue that ICT diffu-sion is complex and is better captured by artificial indicators or metrics.
3.3 Model specifications
The econometric specification of this study is to identify the variables that affect the diffusion of ICT across SSA economies from 2012 to 2022. The empirical framework progressively shifts from a conven-tional Ordinary Least Squares (OLS) model to a more dependable two-step System Generalized Method of Moments (GMM) estimator. This method ensures methodological rigor, corrects for endogeneity, and considers the dynamic nature of ICT diffusion.
3.3.1 Ordinary Least Squares (OLS) Model
The baseline model is first provided in the following linear format:
Where, ICT_it represents the ICT diffusion index in country i at time t, ln_GDPPC represents income per capita, ln_ELEC represents electricity access, ln_DCPS represents financial development, ln_GFCF represents gross fixed capital formation, and ln_URB represents urbanization level.
OLS provides a simple and intelligible framework for figuring out the average impact of the inde-pendent factors on ICT diffusion. On the other hand, E(ε_it|X_it)=0 assumes that all unobserved compo-nents have no correlation with the regressors. This assumption rarely holds true in panel data situations because countries often display unobserved variability, such as institutional quality, geography, and historical legacies that affect both ICT dissemination and its drivers (Baltagi, 2021). Neglecting these time-invariant country-specific effects leads to skewed and inconsistent estimates (Wooldridge, 2010;
Hsiao, 2014). Moreover, OLS fails to capture the dynamic persistence of ICT diffusion, where past ICT levels impact present diffusion rates, thereby ignoring temporal dependence in digital transformation processes (Arellano & Bond, 1991).
3.3.2 Fixed Effect (FE) Model
The research goes beyond a Fixed Effects (FE) specification in order to reduce omitted variable bias brought on by unobserved heterogeneity:
In this case, μ_t denotes time-specific effects that take into consideration worldwide economic or technological shocks, whereas α_i stands for unobserved country-specific effects. The FE model effec-tively removes country-level time-invariant heterogeneity, resulting in within-country estimates that illustrate the impact of changes in explanatory factors over time on ICT diffusion (Wooldridge, 2010).
However, there are also disadvantages to the FE estimator. First, dynamic relationships cannot be taken into account because dynamic panel bias would result from the regressor becoming correlated with the error term when a lagged dependent variable (like ICT_i,(t-1)) is added (Nickell, 1981). Second-ly, it disregards endogeneity arising from reverse causality or simultaneity. For instance, by promoting financial development or GDP per capita, ICT expansion may result in bi-directional causality (Asongu & Biekpe, 2017; Roodman, 2009). Therefore, FE cannot fully capture the dynamic and endogenous nature of ICT dissemination, even if it improves OLS by taking unobserved heterogeneity into account.
3.3.3 Difference GMM (Arellano-Bond, 1991)
In order to address the dynamic bias and endogeneity issues, Arellano & Bond, (1991), introduced the Difference GMM estimator, which is suitable for panels with many countries (N) and few time periods (T), such as in SSA situations. To take dynamic effects into consideration, a lagged dependent variable is incorporated into the model:
The country-specific effects (μ_i) are eliminated when the first difference is taken:
The lag levels of the endogenous regressors are tools for their different forms.This helps over-come simultaneity bias and unobserved heterogeneity (Arellano & Bond, 1991; Baltagi, 2021).
Despite its advantages, the Difference GMM estimator has serious disadvantages. Poor tools for first-differenced variables include lagged levels of time-persistent variables like GDP per capita or ICT diffusion, which leads to weak identification and instrument proliferation (Blundell & Bond, 1998; Rood-man, 2009). Because of this, estimates may be susceptible to efficiency loss and finite-sample bias, espe-cially when sample time is short and data variability is low.
3.3.4 System GMM (Blundell & Bond, 1998; Arellano-Bover, 1995)
To overcome these limitations, Arellano & Bover, (1995) and Blundell & Bond, (1998), developed the System GMM estimator, which combines the equation in levels with the equation in first differences to create a system. Lagged differences of the variables are tools for the level equation, and lagged levels are tools for the differenced equation. The model is expressed as follows:
This dual-equation structure increases instrument strength and estimate efficiency when variables show strong persistence (Blundell & Bond, 1998). The two-step version of the estimator further improves as-ymptotic efficiency by using a weighting matrix that accounts for autocorrelation and heteroskedasticity in the residuals (Windmeijer, 2005).
As a result, System GMM effectively addresses the three primary econometric issues in dynamic panel estimation: Unobserved country-specific heterogeneity; Endogeneity of the regressor due to simul-taneity or reverse causality; and Dynamic panel bias due to lagged dependent variables (Roodman, 2009; Baltagi, 2021).
Furthermore, it performs well for panels with large N and small T, as is typical for data from Sub-Sa-haran Africa (Arellano & Bover, 1995; Blundell & Bond, 1998). The validity of the estimator is often as-sessed using the Hansen/Sargan tests for instrument validity and the Arellano–Bond AR(2) test for serial correlation.
The current study uses the two-step System GMM estimator to empirically examine the factors influencing ICT diffusion in 37 SSA countries between 2012 and 2022 in light of these advantages. This method is a reliable, consistent, and efficient way to estimate the dynamic and interdependent relation-ships between ICT dissemination, economic prosperity (GDPPC), energy access (ELEC), financial develop-ment (DCPS), capital formation (GFCF), and urbanization (URB). Because the estimator’s design ensures that endogeneity, simultaneity, and omitted variable biases are appropriately addressed, it is the best choice for analyzing the dynamics of ICT dissemination across diverse and evolving Sub-Saharan African countries.
4. Pre-estimation Tests and Descriptive Statistics
4.1 ICT Diffusion Index
The dataset’s suitability for multivariate analysis was thoroughly examined using a number of di-agnostic tests, such as evaluations of multicollinearity, intercorrelation between variables, and sampling adequacy, before the dynamic panel model was estimated. These analyses are necessary because the dependent variable, the composite ICT diffusion index, which was created, using Principal Component Analysis (PCA) and combines nine different indicators of digital infrastructure and access, is multidimen-sional (see Table 1).
Table 1
ICT-diffusion index components
Table 2
Description of variables
Table 3
Descriptive Statistics
Table 4
Covariance Analysis
Table 5
Stationary Test
ICT diffusion.
Table 6
Multicoleaniarity
| MULTICOLEANIARITY | ||
|---|---|---|
| Variable | VIF | 1/VIF |
| ln_GDPPC | 2.76 | 0.361931 |
| ln_ELECTRICITY | 3.05 | 0.327919 |
| ln_UP | 2.50 | 0.400600 |
| ln_DCPS | 1.40 | 0.711886 |
| ln_GFCF | 1.06 | 0.942922 |
| Mean VIF | 2.15 | |
Table 7
Heteroskedasticity
Table 8
Cross-Sectional Dependency
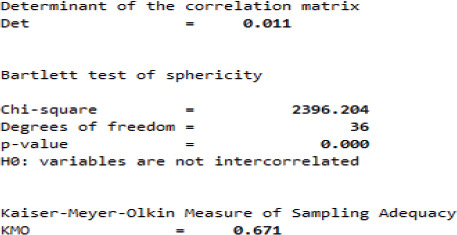
There were significant inter-correlations between the underlying ICT variables, as indicated by the correlation matrix’s determinant of 0.011. Effective dimensionality reduction with PCA requires that the variables have a low determinant value near zero, which indicates that they share a significant amount of common variance (Jolliffe & Cadima, 2016; Brauner & Shacham, 2000). This result validates the creation of a composite index since it captures the existence of latent constructs like connectivity, accessibility, and the development of digital infrastructure that underlie the spread of ICT in Sub-Saharan Africa (SSA).
Bartlett’s Test of Sphericity, which produced a highly significant chi-square statistic (χ2 = 2396.204, df = 36, p < 0.001), supports this conclusion even more and rejects the null hypothesis that the correlation matrix is an identity matrix. This outcome supports the use of factor analytic techniques by confirming that the observed variables are significantly intercorrelated (Dziuban & Shirkey, 1974). This, test con-firms that various ICT metrics, including internet usage, mobile penetration, fixed broadband subscrip-tions, and secure server density, can be combined into a single, easily interpreted composite index that reflects the complex nature of digital diffusion in SSA nations.
Furthermore, Kaiser, (1974), definition of the “acceptable” range (0.6-0.7) was supported by later methodological literature, and the Kaiser-Meyer-Olkin (KMO) Measure of Sampling Adequacy was com-puted at 0.671 (Hair, et al. 2019). This number suggests that the data are only marginally appropriate for factor analysis, but it also draws attention to some possible drawbacks: measurement noise or structur-al heterogeneity among SSA nations may cause some variables to show weaker partial correlations or higher residual correlations. Kaiser, (1974) points out that KMO values less than 0.8 indicate that factor loadings should be interpreted cautiously and may call for item refinement or sensitivity analyses.
Overall, the pre-estimation tests verify that the information is suitable for sophisticated economet-ric analysis. The composite ICT diffusion index is a valid tool for examining the dynamic interactions be-tween financial, infrastructure, and economic factors influencing digital transformation in Sub-Saharan Africa. It is theoretically supported, empirically supported, and statistically sound.
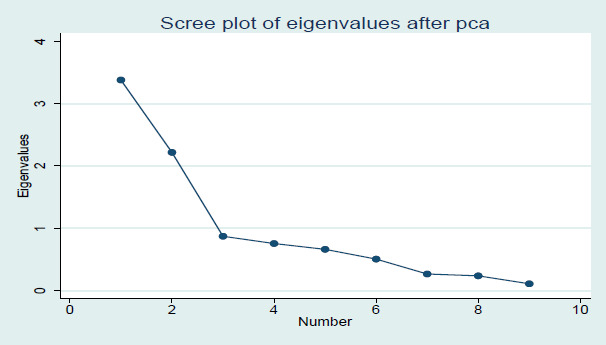
For the ICT Diffusion Index in Sub-Saharan Africa, the scree plot validates a two-component PCA solution, with eigenvalues >1 and a distinct elbow following Component 2. This compact design, which includes “infrastructure connectivity” and “population access,” validates the combination of nine ICT indicators into a single, reliable index. In conjunction with previous diagnostics (KMO=0.671, Bartlett’s p<0.001), it supports the use of System GMM to model the ways in which investment, credit, urbanization, GDP, and electricity influence the diffusion of digital technology. The method tackles endogeneity and persistence, providing policymakers with a sophisticated, empirically supported framework to close the digital divide in SSA by implementing focused, multi-sectoral interventions.
4.2 Descriptive Statistics
Descriptive statistics below show that ICT diffusion and its factors vary significantly throughout Sub-Sa-haran Africa.
While domestic credit and GDP per capita are widely distributed, indicating unequal economic and financial development, the ICT diffusion index exhibits significant variation, reflecting both progress and enduring gaps. Urbanization and electricity availability are more evenly distributed, though certain nations are still underserved. According to skewness values, the majority of nations group together at lower credit and income levels, while infrastructure metrics tend toward higher averages, with laggards pushing the distribution to the left. Concentration of extreme outliers is indicated by high kurtosis for credit and capital formation. Jarque-Bera results validate the use of dynamic estimators by rejecting normality for all variables. In general, the information emphasizes digital divides, structural inequality, and the interconnectedness of financial, structural, and economic elements influencing ICT diffusion.
The covariance analysis shows that ICT in Sub-Saharan Africa is most strongly correlated with elec-tricity access (0.456) and GDP per capita (0.617), confirming the crucial roles that infrastructure and income play in promoting digital adoption. Finance serves as a facilitator of ICT investment, as evidenced by the moderately positive correlation (0.389) between domestic credit to the private sector. Urbaniza-tion has a smaller but still beneficial effect (0.233), suggesting that while population density encourages adoption, it is limited by policy gaps and affordability. The gross fixed capital formation, on the other hand, shows a very weak or non-existent association (0.026), indicating that overall investment is not consistently focused on ICT development. Overall, the results show that while widespread investment and urbanization have limited effects, prosperity, infrastructure, and financial deepening are the main factors that enable ICT and urbanization have limited effects, prosperity, infrastructure, and financial deepening are the main factors that enable ICT.
ICT diffusion, GDP per capita, electricity access, urban population, gross fixed capital formation, and domestic credit are all confirmed to be stationary at levels (p < 0.001) by the Levin-Lin-Chu stationarity test. This ensures trustworthy causal inference by validating the use of System GMM without differenc-ing. Because stationary variables guard against spurious regression, the results validate the robustness of the model. Convergent digital development trends in SSA are reflected in the ICT index, which is de-rived from PCA and stays constant. This supports the study’s policy relevance in addressing Africa’s digital divide by allowing for an accurate estimation of the ways in which economic, infrastructural, and financial factors work together to drive
The System GMM model’s coefficient reliability is ensured by the VIF results, which show no severe multicollinearity (mean = 2.15; max = 3.05 for electricity access) (O’brien, 2007; Hair, et al., 2019). This supports the concurrent inclusion of investment, financial credit, urbanization, electricity access and GDP as separate forces behind the spread of ICT in SSA. Low VIFs show that each variable has a distinct explanatory power, which is important for policy targeting. The results reinforce causal inference on how economic, and structural, and financial factors collectively bridge Africa’s digital divide by filling in gaps in previous research that looked at determinants separately (Myovella et al., 2021; Asongu & Biekpe, 2017).
As expected given structural differences, the Breusch-Pagan test (χ2 = 44.36, p < 0.001) demonstrates heteroskedasticity and non-constant error variance across SSA countries (Myovella et al., 2021). None-theless, the two-step System GMM estimator automatically accounts for heteroskedasticity through ro-bust standard errors, so this does not render inference invalid (Blundell & Bond, 1998; Roodman, 2009). Estimates of the coefficients for GDP, electricity, credit, and investment are therefore still trustworthy. This robustness is important for policy because it guarantees that results on ICT drivers represent real economic relationships rather than statistical artifacts, supporting focused interventions to close the digital divide in Africa Asongu & Biekpe, 2017; World Bank, 2023).
In SSA, there are notable spatial spillovers in ICT diffusion, GDP, electricity access, urbanization, investment, and credit, according to the cross-sectional dependence (CD) test, which shows strong evi-dence of inter-country correlation across all variables (p < 0.001) (Pesaran, 2004; Myovella et al., 2021). Because of common economic shocks, trade, and policy dynamics, this illustrates regional interdepen-dence. The outcomes support the application of System GMM, which takes these dependencies into con-sideration and guarantees reliable estimation (Roodman, 2009).
It is crucial to use sophisticated panel techniques to capture Africa’s interconnected digital development landscape because neglecting this dependence could result in biased inference (Baltagi, 2005).
5. Theoretical and Methodological Justification for System GMM Estimation
Due to the dynamic and endogenous nature of ICT diffusion which is fuelled by enduring adoption patterns, reversed causality, and unobserved country-specific variability an estimator that simultane-ously addresses these econometric challenges is necessary.
Despite providing initial insights, fixed effects (FE) and pooled OLS models are fundamentally limited: OLS generates upward-biased estimates due to omitted heterogeneity, whereas FE suffers from Nickell bias when there is a lagged dependent variable. Difference GMM is inadequate in our case, even though it was designed to instrument first-differenced equations with lagged levels in order to manage endog-eneity and dynamics.
Using (Bond, 2002), rule-of-thumb diagnostic to compare the autoregressive coefficient (
Table 9
OLS, Fixed-Effect and Difference GMM estimate comparison
In panels with “large N, small T” structures exactly the arrangement of this study balanced sample of 37 SSA countries from 2012 to 2022 this approach lowers bias, boosts finite-sample efficiency, and strengthens instrument relevance. The validity of this decision is further supported by the Hansen test, which verifies instrument exogeneity, the Arellano-Bond AR(2) test, which rejects second-order serial correlation, and pre-estimation checks (stationarity, low multicollinearity, and cross-sectional depen-dence) that validate the suitability of dynamic panel techniques. System GMM combines economic pros-perity (GDP per capita), energy access, financial depth (DCPS), investment (GFCF), and urbanization into a single dynamic framework, offering a methodologically sound and policy-relevant foundation for ad-vancing digital inclusion across the region. This makes it possible to estimate the causal, interdependent drivers of ICT diffusion consistently.
6. The Two-Step System GMM Estimator’s Stability and Validity
The robustness of the study empirical findings depends critically on the two-step System GMM es-timator’s internal consistency and statistical validity. To ensure that our estimates are stable and con-sistent across model settings, the study conduct a variety of diagnostic tests and sensitivity studies, the results of which are compiled in Table 10.
Table 10
Model Stability Test and Valid Instrument identification (Two Step System GMM Estimations)
This table presents the coefficient estimates, significance levels, and key diagnostic statistics, in-cluding the F-test for instrument relevance, the Arellano-Bond AR(2) test for serial correlation, and the Hansen over-identification test, across six nested model specifications that progressively change the lag structure of the instruments (from lag 2 to lag 6).The consistency of coefficient signs, magnitudes, and statistical significance across different models provides strong evidence of estimator dependability.
First, for all models, the autoregressive coefficient (
Second, the primary explanatory factors' significance and direction have not changed much. GDP per capita (ln_GDPPC) has a strong positive and very significant effect on ICT diffusion in all six models (p < 0.01), supporting H1 and agreeing with both international and SSA-specific literature (Baliamoune-Lu-tz, 2003; Myovella et al., 2021). The consistent big, positive, and statistically significant coefficient of urbanization (ln_UP) supports both H5 and the agglomeration logic of new economic geography (Fujita & Krugman, 2004; Sapienza et al., 2023). The conditional role of financial deepening in enabling digital investment and offering qualified support to H3 is represented by the similarly positive and significant domestic credit to the private sector (ln_DCPS) in five of the six models (Owusu-Agyei et al., 2020; Tekle-mariam & Kwon, 2020). Given the strong correlation between structural enablers (see Table 4), its initial positive and significant estimate in Model 1 (p = 0.02) is in line with micro-level evidence from Senegal and West Africa (Houngbonon & Quentrec, 2019; Owolabi et al., 2023). This suggests that its effect might be partially absorbed by income or urbanization in more saturated specifications. But in later models, access to electricity (ln_ELECTRICITY) becomes less important.
Importantly, each model meets the diagnostic standards required for the validity of the System GMM. The null hypothesis of authentic and exogenous instruments is not rejected in any specification since the Hansen J-test for over-identifying limitations yields p-values significantly above 0.10 (ranging from 0.31 to 0.85). This supports the use of deeper lags (up to t-6) as instruments since it lowers the likelihood of instrument proliferation while preserving identification strength (Roodman, 2009). The Arellano-Bond AR(2) test for second-order serial correlation in the first-differenced residuals not only fails to reject the null (p > 0.05 in all models), but it also validates the use of lagged levels as instruments and confirms that there is no problematic serial correlation (Arellano & Bond, 1991; Blundell & Bond, 1998). Furthermore, even though the instrument relevance is not formally reported via Cragg-Donald statistics due to the system nature of the estimators, the high explanatory power (R2 > 0.75 in all models) and stable coefficient estimates implicitly confirm it, and the F-statistics for the joint significance of the regressors are overwhelmingly significant (p < 0.001).
When taken as a whole, these diagnostics verify that our System GMM specification is free from weak instrumentation, overfitting, and incorrect inference. Typical challenges in dynamic panel estima-tion (Roodman, 2009; Windmeijer, 2006). Concerns regarding arbitrary instrument selection are allayed by the results' consistency across various lag structures, which further demonstrates the model's stabil-ity. This robustness is particularly important in the context of SSA, where cross-sectional dependence, structural heterogeneity, and data constraints can easily skew traditional estimators (Table 8, CD test p < 0.001). By satisfying the basic assumptions of System GMM exogeneity, the lack of second-order serial correlation, and instrument relevance, our model provides trustworthy causal estimates of the variables affecting ICT dissemination.
All things considered, the two-step System GMM estimator is theoretically appropriate for captur-ing the dynamic, endogenous, and heterogeneous nature of digital transformation in SSA (as argued in Sections 3.3.4 and 5), and it has also been empirically validated through extensive diagnostic testing and sensitivity analysis. The stability of coefficients, signs, and significance across specifications, along with the passing of diagnostic thresholds, make our policy conclusions about the critical roles of income, ur-banization, and financial depth in bridging the digital divide methodologically sound, reproducible, and relevant to policy.
7. Results and Discussions
7.1 Robustness and Consistency of Results
To ensure empirical robustness, the study looked at results from three estimate methods: Difference GMM, Robust Least Squares (RLS), and the suggested Two-Step System GMM model (Tables 11-12). The comparison demonstrates a remarkable consistency in the signs, magnitudes, and statistical significance of the primary explanatory factors, confirming the stability of the computed correlations.
The positive coefficients maintained by GDP per capita, access to electricity, domestic credit to the private sector, gross fixed capital formation, and urbanization across all specifications support the the-oretical expectations and assumptions (H1-H5). Even though coefficient magnitudes vary greatly due to methodological refinement, the directional stability across models demonstrates that the results are unaffected by sample differences or estimate methodologies. The dynamic persistence of ICT diffusion in SSA is highlighted by the fact that the lagged dependent variable (ICT diffusion_(t-1)) is consistently positive and highly significant across all models.
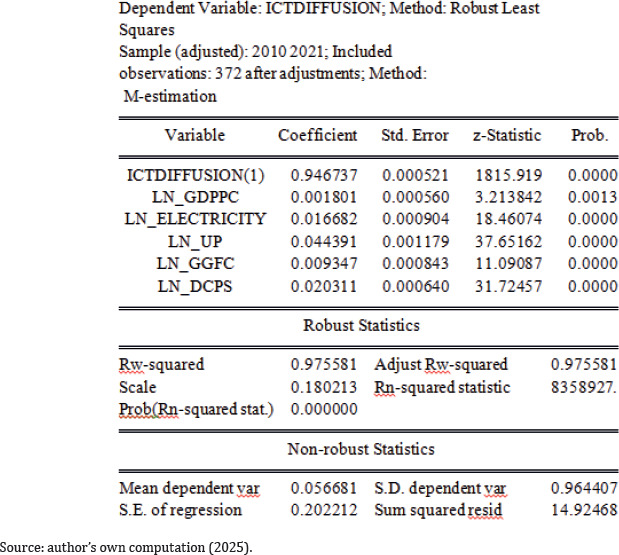
Table 12
Optimal model – Arellano Bond Dynamic Panel Estimations
After moving from the Difference GMM (Arellano-Bond) to the Two-Step System GMM, the coefficient efficiency and significance levels increase. As an example of increased efficiency due to increased in-strumentation and dual-equation estimation, the coefficients for domestic credit (0.108 → 0.128), ur-banization (0.927 → 1.039), and GDP per capita (0.324 → 0.387) all exhibit a slight increase as standard errors decrease. Furthermore, access to electricity and capital formation continue to provide positive and significant benefits in all situations, despite differences in their magnitudes. The alignment of robust OLS, Difference GMM, and System GMM shows that the estimated drivers of ICT diffusion are statistically sound, empirically robust to different model settings, and economically significant
7.2 Main Results: Two-Step System GMM Estimation
The Two-Step System GMM estimator is the most appropriate specification for this study since it can take into consideration the endogeneity, simultaneity, and country-specific variability that are present in dy-namic panel data. As the model passes all significant diagnostic checks and the Hansen test fails to reject instrument validity (p > 0.10) and the Arellano-Bond AR(2) test reveals no second-order autocorrelation, the results are dependable and efficient.
The positive lagged ICT diffusion index, which is statistically significant at the 1% level (ρ = 0.575, p < 0.001), confirms the significant path dependence in digital adoption across SSA. This outcome is in line with Rogers, (1983), diffusion theory, which maintains that network effects and learning-by-doing produce an S-shaped curve in technology adoption. The magnitude implies that past ICT infrastruc-ture and use have a major influence on current dispersion and emphasizes the importance of early in-vestments in digital ecosystems. The System GMM coefficient is more accurate (lower standard error: 0.020 vs. 0.026) and more economically reasonable than the attenuated estimate from Difference GMM (
The enormous, favourable, and highly significant impact of GDP per capita on ICT diffusion (β = 0.387, p < 0.001) strongly supports H1. According to the demand-side logic of diffusion theory, which maintains that greater wealth makes devices, data plans, and digital services more affordable, this finding is in line with findings from both international and SSA-specific sources (Baliamoune-Lutz, 2003; Myovella et al., 2021). Interestingly, the System GMM estimate understates the true income elasticity due to insufficient instrumentation, as evidenced by the Difference GMM estimate (0.324), which is 19.6% lower. This lends credence to the notion that economic growth remains a necessary condition for digital inclusion in SSA, even in the absence of infrastructure and institutional enablers.
The positive and statistically significant impact of electricity access on ICT diffusion (β = 0.195, p = 0.020) supports H2. In line with micro-level data, Senegal and West Africa claim that rural areas' elec-tricity boosts smartphone ownership and digital engagement (Houngbonon & Quentrec, 2019; Owola-bi et al., 2023). However, compared to income and urbanization, the effect size is small, and Table 10 demonstrates that this significance vanishes in models with deeper lags (Models 2–6), suggesting that either of these factors may partially mediate the role of electricity. This conditional feature aligns with the literature's caution that energy access alone cannot encourage digital engagement in the absence of affordability, digital literacy, and network coverage (Salat et al., 2021).
Urbanization has the largest marginal effect of all the factors (β = 1.039, p = 0.001), which strongly supports H5. This finding aligns with new economic geography frameworks Fujita & Krugman,(2004), which propose that urban agglomeration economies concentrate specialized labor, reduce deployment costs per user, and foster digital service ecosystems. Empirical research indicates that ICT adoption is higher among urban SSA families and businesses (Odusanya & Adetutu, 2020; Girollet, 2024). The ur-ban-rural digital divide can be lessened by certain rural connection measures, such as universal service funds or infrastructure subsidies, according to recent research, but this urban advantage also carries the risk of worsening spatial inequality (Fei et al., 2024).
Supporting H3 and highlighting the role of finance in enabling digital investment by households and businesses is the positive and highly significant domestic credit to the private sector (DCPS) (β = 0.128, p < 0.001). This is consistent with studies showing that financial deepening facilitates ICT adoption by improving access to credit and mobile money (Owusu-Agyei et al., 2020; Teklemariam & Kwon, 2020). The System GMM estimate shows better identification, as it is significantly more accurate than the Dif-ference GMM result (SE: 0.022 vs. 0.053).
However, the modest but statistically significant positive effect of gross fixed capital formation (GFCF) (β = 0.107, p = 0.001) provides some support for H4. Even though aggregate GFCF is often criticized as a crude proxy for ICT investment, its significance in this context suggests that macroeconomic stabil-ity and the overall investment climate may indirectly support digital infrastructure, perhaps through public-private partnerships or spillovers from non-ICT sectors (Ofori & Asongu, 2021). Nonetheless, the low coefficient indicates that quality of investment is more significant than quantity, bolstering the need for ICT-specific targeted capital allocation (Nchake & Shuaibu, 2022).
Overall, the System GMM results demonstrate that ICT diffusion in SSA is fuelled by a combination of financial intermediation, spatial concentration, economic capability, and foundational infrastructure. Demand is created by income, but its impact is amplified by urbanization and the availability of credit; power enables use, but its returns depend on affordability and digital literacy. No one element operates in isolation. These findings complement the integrated theoretical approach described in Section 2 and fill significant gaps in previous studies that examined determinants in silos.
8. Conclusion and Recommendation Sections
8.1 Conclusion
This study looked closely at the variables affecting the adoption of ICT in Sub-Saharan African (SSA) economies from 2012 to 2022. It used a two-step System Generalized Method of Moments (System GMM) estimator to account for the dynamic, endogenous, and interdependent nature of ICT dissemination while addressing the econometric shortcomings of conventional OLS, Fixed Effects, and Difference GMM esti-mators. Particularly in the presence of persistent series and country-specific variability, the approach ensured objective and reliable parameter estimations.
The empirical results provide compelling evidence that the diffusion of ICT in SSA is significantly in-fluenced by economic, financial, infrastructural, and spatial factors. As demonstrated by the consistently positive and statistically significant effect of GDP per capita, economic prosperity raises the affordabil-ity and adoption of digital technology. Urbanization, which is a reflection of the concentration of digital ecosystems, human resources, and infrastructure in metropolitan areas that encourage the spread of technology, was another important factor that surfaced. The importance of financial depth in supporting digital expansion was highlighted by the significant positive correlation found between ICT dissemina-tion and financial growth as indicated by domestic lending to the private sector. Access to electricity also had a favourable but conditional effect, indicating that energy availability supports digital engagement, even though affordability and income may act as a mediating factor. A modest but positive contribution from gross fixed capital formation suggests that the quality and character of investments matter more than their total size.
Overall, the results demonstrate that ICT diffusion in SSA is driven by the interaction of multiple reinforcing factors rather than a single determinant. A number of variables, such as urban concentra-tion, financial deepening, infrastructure accessibility, and economic capacity, affect the pace and scope of technological diffusion across the region. Further proof that the trajectory of digital transformation is cumulative and path-dependent comes from the significant lagged dependent variable, which indicates that ICT diffusion has continued over time.
This study essentially contributes to the empirical literature by providing a dynamic and all-encom-passing paradigm that captures the complex nature of ICT dissemination in SSA. The results indicate that the synergistic effects of structural, financial, and economic enablers working together rather than sep-arately are necessary for sustainable digital advancement. A deeper understanding of the mechanisms driving Sub-Saharan Africa’s digital advancement is made possible by this comprehensive perspective.
8.2 Recommendations
The study’s conclusions indicate that the adoption of ICT in Sub-Saharan Africa (SSA) is a compli-cated and dynamic process that is influenced by economic, financial, spatial, and infrastructure factors. In light of these empirical findings, several evidence-based recommendations can be made for academic, institutional, and development stakeholders seeking to improve digital transformation in the region.
First, GDP per capita, a measure of economic progress, was the most accurate indicator of ICT dis-semination. This highlights the necessity of persistent efforts toward broad-based economic growth and structural diversification, which increase disposable income and lower the cost of digital technology. Second, domestic loans to the private sector demonstrate how financial development supports ICT use. Developing financial markets, expanding access to digital credit, and bolstering financial intermediation can all help consumers and businesses invest in ICT infrastructure and services.
Third, the diffusion of ICT is significantly and statistically significantly impacted by urbanization, which is a sign of the agglomeration effects of infrastructure, connectivity, and trained labour in urban areas. Urban centers continue to drive digital growth, but it is clear that underserved rural areas must have access to ICT infrastructure and services to ensure balanced dissemination. Digital connectivity still requires power access. Investments that improve the affordability, coverage, and reliability of energy are necessary to ensure digital inclusion. Lastly, gross fixed capital formation indicates that, although having a slight impact, ICT-specific targeting and investment quality are more important than overall investment size. Therefore, prioritizing strategic investments in ICT-enabling sectors can increase the returns on digital infrastructure.
Collectively, these findings show that ICT spread is not merely a technology event but rather a pro-cess of structural and economic change requiring coordinated multi-sectoral activity.
9. Limitations of the Study
Although this study’s methodology is sound, there are several limitations that should be considered when interpreting the findings. The analysis used secondary macroeconomic panel data from the World Bank’s World Development Indicators (WDI), which, while comprehensive, may not fully take into consid-eration micro-level behavioural factors that influence ICT diffusion, such as digital literacy, institutional quality, and regulatory efficacy.
Second, the study used Principal Component Analysis (PCA) to create a composite ICT diffusion index. Aggregation may mask the distinctions between some ICT components (e.g., internet, mobile, and broadband penetration), even though it provides a comprehensive evaluation of digital dissemination. Disaggregated analysis may reveal more complex sector-specific correlations. Third, although the Sys-tem GMM estimator effectively manages endogeneity, it remains vulnerable to measurement errors and instrument proliferation. Even when diagnostic testing confirmed the validity and stability of the instru-ments, residual model dependencies and omitted variable biases cannot be totally ruled out.
The study’s time frame (2012-2022) also limits its ability to account for potential post-2022 events, such as new technological developments or legislative changes that might alter the region’s digital adop-tion paths.
10. Future Paths for Research
Building on these findings and limitations, future research could broaden the current study in sev-eral ways. First, integrating governance quality, institutional efficiency, and regulatory frameworks into the analytical model would allow for a more complete understanding of how institutional elements im-pact ICT diffusion results. Second, it might be feasible to find organizational, behavioural, and socio-de-mographic characteristics that are not apparent in aggregate national data by employing micro-level or firm-level datasets. Third, to determine whether specific ICT types such as broadband, digital financial services and mobile connectivity respond differently to financial, infrastructure, and economic factors, future research may deconstruct the ICT index. This would help find sector-specific policy levers and complementarities.
Additionally, the use of spatial econometric models could demonstrate how geographic spillovers and regional interdependencies aid in the diffusion of digital technology among neighboring SSA coun-tries. Finally, by including post-pandemic statistics, future studies will be able to examine the structural changes caused by COVID-19, including the growth of e-learning, remote work, and digital finance, po-tentially uncovering new trends in the region’s digital transformation.