1. Introduction
Agricultural productivity is one of the key factors determining competitiveness, the stability of farmers’ incomes, and food security in the European Union. In the face of intensifying climate challenges, rising production costs, and growing public expectations regarding sustainable development, the issue of productivity is not only economic one but also political and social. In this context, the Common Agricultural Policy (CAP) plays a fundamental role, shaping the framework for the agricultural sector’s operation through a system of direct payments, investment support instruments, and pro-environmental measures. Previous research on productivity has considered both traditional partial measures (land, labour, or capital productivity) and more complex multifactor indicators (TFP – Total Factor Productivity). In recent decades, approaches based on Data Envelopment Analysis (DEA) and the Malmquist index have been increasingly used; these allow for the decomposition of productivity changes into two basic components: improvements in technical efficiency (EC) and technological progress (TC). This approach enables a more precise identification of the sources of growth and the mechanisms of convergence or divergence within the Common Agricultural Market. At the same time, there is a research gap in literature regarding long-term, comparative analyses of productivity changes in European agriculture that simultaneously account for the impact of CAP reforms. Most existing studies focus on selected countries or shorter time periods, whereas a comprehensive assessment of agricultural development across the entire EU requires a panel approach covering the full cycle of three consecutive agricultural policy reforms: the Health Check (2008), “greening” (2014-2020), and the new CAP (2021-2027).
The aim of this article is to assess the dynamics of agricultural productivity in EU Member Atates from 2007 to 2023, identify the sources of growth (efficiency versus technology), and analyse the impact of key CAP reforms on the diversification of development trajectories. The study employs Malmquist indices and their decomposition (MQ, EC, TC), supplementing the analysis with partial measures and structural data, which made it possible not only to identify productivity leaders and laggards but also to analyse the occurrence of the catching-up effect.
The following research questions were posed:
- How did agricultural productivity in EU countries evolve between 2007 and 2023?
- What were the main sources of growth – improvements in efficiency or technological progress? −
- What impact did successive CAP reforms have on productivity growth and convergence processes among countries?
Attempting to answer these questions is significant not only from a theoretical perspective but also practical: they indicate how future CAP reforms can be designed to simultaneously support innovation, efficiency, and the sustainable development of European agriculture.
2. Literature Review
In economic literature, productivity is most often defined as the ratio of output volume to the use of resources (inputs), and thus as a measure of the ability to transform inputs into outputs (OECD, 2001; Latruffe, 2010). In agriculture, due to the complex structure of production factors (land, labour, capital, working capital) and the significant role of natural constraints, productivity is analysed both in terms of factor-specific and total productivity.
Partial productivity refers to a single factor of production, such as land productivity (yield or value of production per hectare), labour productivity (value of production per unit of labour input), or capital productivity (value of production per unit of capital employed). In contrast, a more complex measure is total factor productivity (TFP), defined as the ratio of aggregate output value to aggregate input value (Caves et al., 1982; OECD, 2001). An increase in TFP reflects that portion of output growth which is not the result of a simple increase in inputs but rather stems from improvements in technical efficiency, technological progress, organisational changes, or economies of scale (Diewert, 1980; Coelli, Rao, 2005; O’Donnell, 2010). Literature emphasizes that TFP is a key measure of the agricultural sector’s long-term competitiveness, helps determine the level of farm income, and is an important factor in economic growth in rural areas (Ball et al., 2010; O’Donnell, 2010; Latruffe, 2010; Fuglie, 2018; Steensland, 2021).
Analyses by the FAO (2020), the OECD (2001), and the European Commission (2018) indicate that, from a sectoral perspective, TFP is the most appropriate measure for assessing long-term agricultural productivity. This is because it simultaneously accounts for changes in the use of all basic factors of production and allows for distinguishing the effects of intensification from a simple increase in inputs. Steensland (2021) emphasises that TFP allows for a comprehensive assessment of technological innovations, organisational changes, and improvements in resource management in agriculture, which takes on particular significance in the context of increasingly stringent environmental and climate requirements.
Two main methodological approaches dominate research on agricultural efficiency and productivity. On the one hand, nonparametric methods based on Data Envelopment Analysis (DEA) and numerical indices are used; on the other - parametric stochastic frontier analysis (SFA) models. Both approaches allow for the estimation of technical efficiency and the examination of changes in productivity over time (BravoUreta et al., 2007; Fried et al., 2008; Kumbhakar and Lovell, 2000; Kumbhakar et al., 2014).
The classical, nonparametric construction of the TFP index was proposed by Caves, Christensen, and Diewert (1982), building on the concept developed by S. Malmquist (1953). The use of distance functions allows total factor productivity to be defined as the quotient of aggregated outputs and inputs, assuming that these functions are non-decreasing and linearly homogeneous. Färe et al. (1992, 1994) expanded on this concept by proposing a Malmquist index based on the geometric mean of two temporally adjacent TFP indices and its decomposition into two main components: efficiency change (EC) and technical change (TC). Extensions and applications of these concepts in agriculture are presented, among others, by Coelli and Rao (2005), Althin (2001a), Čechura et al. (2014), and Bokusheva and Čechura (2017).
The use of linear programming and DEA assumptions allows for the calculation of TFP indices without the need to know the price relationships between individual inputs and outputs. The distance functions for inputs and outputs are determined by solving the corresponding linear programming problems. In agricultural research, input-oriented models assuming variable returns to scale (VRS) are often used, which allow for the analysis of productivity changes in the context of minimising inputs for a given level of production (Coelli, Rao, 2005). A detailed description of the procedure for estimating distance functions and decomposing the Malmquist index is provided, among others, by O’Donnell (2011).
DEA and the Malmquist index have found wide application in agricultural research at both the sectoral level (countries, regions) and the microeconomic level (farms). Coelli and Rao (2005) analysed changes in TFP in agriculture across 93 countries from 1980 to 2000, highlighting divergent trends among groups of countries. In the European context, Čechura et al. (2014, 2019) and Bokusheva and Čechura (2017) applied DEA-Malmquist to measure TFP in the agriculture sectors of EU countries (based on FADN data), identifying significant heterogeneity in efficiency levels and TFP growth rates. At the production sector level, TFP indices were used, among other things, in studies of dairy farms (Reinhard et al., 1999) and in analyses of technical-environmental productivity (Chung et al., 1997; Reinhard et al., 1999; OECD, 2001).
Literature also points to the limitations of the classical Malmquist index, based on radial DEA models. These include, among others, the failure to account for slacks, the potential lack of transitivity of comparisons in long time series, and sensitivity to outliers (O’Donnell, 2010). In response, alternative indicators are being developed, such as the Luenberger-Hicks-Moorsteen or Malmquist-Luenberger indices, based on directional distance functions (O’Donnell, 2010). Approaches that integrate productivity assessment with environmental pressure (“green TFP”) are also attracting increasing attention, as reflected in the work of FAO (2020) and Streimikis and Saraji (2022).
At the same time, a line of SFA research is developing in which TFP and technical efficiency are estimated in parametric models that account for a random component and exogenous determinants (Kumbhakar, Lovell, 2000; Fried et al., 2008). Examples of applications in European agriculture are presented, among others, by BravoUreta et al. (2007), Kumbhakar et al. (2014), and Reinhard et al. (1999).
Research on agricultural productivity in the European Union focuses primarily on the level and dynamics of TFP in individual countries, comparisons between the “old” (EU-15) and “new” Member States (NMS, EU-13), and on identifying sources of growth (technological progress, technical efficiency, economies of scale). Even at the global level, Coelli and Rao (2005) showed that among developed countries, the rate of TFP growth in agriculture is gradually declining, while relatively rapid productivity growth is observed in many emerging economies.
With regard to Europe, Čechura et al. (2014, 2019) and Bokusheva and Čechura (2017) demonstrated that TFP at the farm level varies significantly across countries. In some countries, technological progress is the dominant source of growth, while in others – improvements in technical efficiency and economies of scale. Błażejczyk-Majka et al. (2012) further highlighted significant differences in the efficiency and productivity of large field farms and mixed farms in the “old” and “new” EU regions, reflecting differences in agricultural structures, scale of production, and modernisation trajectories.
Comparisons between the EU-15 and the new Member States occupy a special place in literature. Nowak and Kubik (2019) conducted an analysis of TFP in agriculture across the 27 EU countries from 2007 to 2016, based on the Malmquist index and its decomposition (MQ, EC, TC), supplemented by partial productivity indices for land, labour, and capital. The authors demonstrated that in the new Member States (NMS), TFP increased by approximately 9.5%, driven by both positive technological changes and improvements in technical efficiency, whereas in the EU-15, a slight decline in TFP was observed, resulting mainly from a deterioration in technical efficiency despite positive technological progress. An analysis of component indicators revealed that in the NMS, rising labour productivity played a key role in TFP growth, with capital productivity remaining relatively stable and a persistent gap in land and labour productivity relative to the EU15 (Nowak, Kubik, 2019).
Kijek et al. (2019) examined TFP levels and convergence processes in agriculture in the “old” and “new” EU Member States, confirming the existence of convergence processes in productivity levels, albeit at varying rates across individual countries. Stronger convergence trends were observed in the group of new Member States, which was attributed to the intensive modernisation of the sector following accession, an increase in investments co-financed by EU funds, and improvements in technical efficiency. At the same time, research by Zhu, Lansinka, and Van Ittersum (2012) indicates that the EU-15 maintains a sustained advantage in labour and land productivity, while the EU-13 is closing part of the gap mainly through increases in technical efficiency and, to a lesser extent, through technological innovation.
Research by Bielik et al. (2023) on EU-28 agriculture from 2007 to 2018 reveal marked variation in TFP levels and a very strong positive correlation between TFP and labour productivity. Countries with high labour productivity (including the Netherlands, Denmark, France, Germany, and Belgium) also achieve high levels of TFP, while countries with low labour productivity (including Latvia, Poland, Croatia, and Romania) are characterised by lower total factor productivity.
In the context of the European Union, Bielik et al. (2023) analysed TFP convergence in EU-28 agriculture from 2007 to 2018, combining an analysis of TFP indices with measures of inequality (Gini coefficient, Theil index, coefficient of variation) and beta convergence models. The authors confirmed the existence of absolute beta-type convergence – countries with lower initial TFP levels exhibited higher productivity growth rates, indicating a process of “catching up” more developed agricultural economies. At the same time, sigma-divergence was observed, i.e. an increase in TFP variation among countries as measured by classical measures of dispersion. This suggests the coexistence of processes of convergence and divergence in productivity levels. Similar results were obtained by Di Liberto and Usai (2013), who analysed TFP convergence across EU-15 regions – despite certain convergent trends, significant spatial heterogeneity in productivity levels persisted.
At the global level, Miller and Upadhyay (2002) point to the existence of both absolute and conditional TFP convergence among countries, with the pace of convergence depending on factors such as the level of institutional development, trade openness, inflows of foreign direct investment, and the capacity for technology absorption and diffusion. With regard to agriculture, this implies that TFP convergence in the EU is largely determined by individual countries’ ability to utilise CAP instruments, invest in physical and human capital, and innovate, as well as by natural conditions and historical agricultural structures.
The cited studies show that TFP convergence processes in EU agriculture are heterogeneous. On the one hand, some new Member States are catching up; on the other hand, differences between countries in terms of productivity levels persist or are even increasing, especially in the context of varying production intensities, farm structures, and the pace of innovation adoption (Bielik et al., 2023; Kijek et al., 2019; Błażejczyk-Majka et al., 2012). The manner in which EU funds are utilised is also of great importance – analyses by Cechura et al. (2019) and Kumbhakar et al. (2014) show that financial and structural barriers limit the ability of some farms to implement advanced technologies, which may slow the convergence process.
The Common Agricultural Policy (CAP) plays a key role in shaping the economic conditions under which EU agriculture operates and, consequently, influences – both directly and indirectly – TFP growth. European Commission documents identify TFP as one of the main indicators for monitoring the achievement of CAP objectives, including improved competitiveness, stabilisation of agricultural incomes, and sustainable resource management (European Commission, 2018). Conceptually, TFP growth results from the combined impact of a number of factors, such as technological progress, investment in physical capital, human capital development, improvements in production organisation, the diffusion of innovation, and changes in the institutional environment (O’Donnell, 2010; Latruffe, 2010; Fuglie, 2018; FAO, 2020).
A significant portion of literature focuses on the consequences of key stages of CAP reforms. The 2008 Health Check – as noted by Matthews (2011) and Rizov, Pokrivcak, and Ciaian (2013) – by deepening the decoupling process and increasing Pillar II funding, promoted the modernisation of agriculture, particularly in the new Member States. In contrast, the 2014-2020 Reform (“greening”), introduced new environmental requirements (crop diversification, maintenance of the UAA, EFA areas). On the one hand, this contributed to improved environmental outcomes; on the other, it may have temporarily slowed the growth of technological productivity on high-intensity farms. In the most recent studies on the CAP 2021-2027, including analyses by Zhu and Soboh (2022) and the European Court of Auditors (European Court of Auditors, 2024), the growing importance of eco-schemes and a results-oriented approach is emphasised. This increases the complexity of the system and the requirements for managerial competence but, at the same time, creates a potential for long-term TFP growth, particularly through digital-green innovations.
A key theme in literature is the impact of direct and investment support on the technical efficiency and productivity of farms. Rizov, Pokrivcak, and Ciaian (2013) demonstrated that the reform involving the decoupling of payments (decoupling) had a positive effect on the technical efficiency of farms in the EU, increasing the flexibility of production decisions and reducing investment distortions. In turn, Latruffe and Desjeux (2016) demonstrated that the impact of CAP payments on technical efficiency and TFP varies significantly depending on the structure of support – investment and agri-environmental instruments can stimulate modernisation, whilst certain forms of direct payments may hinder it.
The findings of Bielik et al. (2023) indicate that in EU agriculture, TFP growth is closely linked to improvements in labour productivity and investments in modern technologies, often co-financed with public funds. Analyses by the FAO (2020), Fuglie (2018), and Steensland (2021) emphasise that maintaining TFP growth whilst simultaneously reducing environmental pressure requires shifting the focus from simply increasing inputs to intensification based on knowledge and innovation – including human capital development, digitalisation, precision agriculture, and the improvement of agronomic practices. Within the “green TFP” framework, Streimikis et al. (2022) highlight the need to account for environmental costs and externalities when assessing agricultural efficiency, which takes on particular significance in the context of the European Green Deal and the “Farm to Fork” strategy.
Against this backdrop, this study is part of a growing body of research on EU agricultural productivity that uses DEA and the Malmquist index to identify sources of TFP growth and analyse their potential links to successive CAP reforms from 2007 to 2023. It complements existing research, such as that by Nowak and Kubik (2019), Kijek et al. (2019), Bielik et al. (2023), Zhu et al. (2012), and Cechura et al. (2019), by extending the time horizon, simultaneously accounting for efficiency and technological components, and providing an exploratory description of the links between CAP reforms and the dynamics and structure of TFP changes in the agriculture of European Union Member States.
3. Data and Research Methods
3.1 Data1
The data used in the study are sourced from the EUROSTAT database and cover the years 2007-2023. To ensure comparability and consistency in the analysis, variables reflecting the basic factors of production in agriculture were selected: land, capital, and labour. These variables were grouped into sets whose combination reflects the specific nature of the business model of agricultural holdings in European Union countries. The use of a single common efficiency frontier for all EU countries implies the assumption that the analysed decision-making units (coun-tries) operate within a common set of production possibilities. This overlooks differences in natural conditions, production structures, or special-isations (e.g. vineyards, olive groves) but allows for a comparison of relative efficiency and TFP dynamics relative to the same “meta-technology”. Structural differences between countries are indirectly reflected in the shape of the frontier and the distances observed relative to it. In further research, an interesting direction would be to apply a meta-frontier approach, which allows for the explicit modelling of technological heterogeneity.
The following set of variables was used for the analysis:
(Y1) – agricultural output (million EUR),
(X1) – agricultural land area (thousand ha),
(X2) – labour input (thousand AWU),
(X3) – direct costs (million EUR),
(X4) – general economic costs,
(X5) – depreciation (million EUR).
In this study, monetary data were used at current prices. This limitation stems from the unavailability of precise and comparable deflators for all variables, countries, and periods, which could introduce distortions.
Agricultural output (Y1) includes revenues from crop and livestock production, as well as from service activities and subsidies. Direct costs (X3) include expenditures on seeds and seed potatoes, fertilisers, plant protection products, veterinary services, and feed. In turn, general economic costs (X4) include expenditures on energy, materials, building maintenance, agricultural services, depreciation, and other indirect costs. In the DEA model, the number of full-time equivalents (AWU) was adopted as a measure of labour input (X2). This set of variables enables a comprehensive assessment of changes in productivity and resource use in the agriculture of EU countries during the analysed period.
Following an analysis of basic statistics and preliminary model calculations, Cyprus, Luxembourg, and Malta were excluded from the study, as their agricultural models differ too significantly. Consequently, the set of variables is not sufficiently consistent, making it unsuitable for use in the DEA models employed in this study. Data after 2020 also exclude the United Kingdom due to Brexit.
Table 1
Basic descriptive statistics of the variables for the years 2007, 2015, and 2023
Between 2007 and 2023, EU agriculture was characterised by an increase in production accompanied by a decline in employment and agricultural land area. In contrast, financial inputs – both direct and aggregate – as well as depreciation increased, reflecting the process of intensification, modernisation, and concentration of production. At the same time, disparities among EU countries are growing, as evidenced by the rising standard deviations of most variables.
3.2 Measurement and Decomposition of TFP (Total Factor Productivity) Indices1
An analysis of relative productivity dynamics in the EU agricultural sector was conducted using Malmquist’s total factor productivity (TFP) indices. In the classical approach, for one-dimensional inputs and outputs, TFP is defined as the simple ratio of output to input. However, in the context of multidimensional analysis, characterised by the presence of multiple inputs and outputs, TFP is the ratio of aggregate output to aggregate input, which allows for a comprehensive assessment of changes in efficiency.
The theoretical foundations for the TFP indices used in this study were formulated by Caves, Christensen, and Diewert (1982). Their work was based on the concept of S. Malmquist (1953), which involved the use of a distance function to construct a synthetic index measuring changes in a selected factor over time, relative to a chosen base point. These ideas were further developed in the work of Färe et al. (1992), who proposed a model based on the geometric mean of two temporally adjacent Caves indices. A key achievement of Färe et al. was also the presentation of a decomposition of this index into two main components: efficiency change (EC) and technical change (TC).
The use of linear programming (LP) and the assumptions of the Data Envelopment Analysis (DEA) method makes it possible to calculate these indices without requiring information on the price relationships between individual inputs and outputs. In this case, the calculations are based solely on available data regarding inputs and outputs, using appropriate distance functions.
Assuming that:
and are vectors of inputs and outputs, the total productivity of entity i in period t is:
where Qit = Q(qit) is the aggregate output, Xit = X(xit) is the aggregate input, Q(.) and X(.) are non-decreasing, non-negative, linearly homogeneous functions.
In turn, assuming that D (.) are the output or input distance functions, the Malmquist TFP index calculated in this way can be decomposed into two main components, namely efficiency changes (EC) and technology changes (TC). An example of this notation is presented in Equation (2), Althin (2001b):
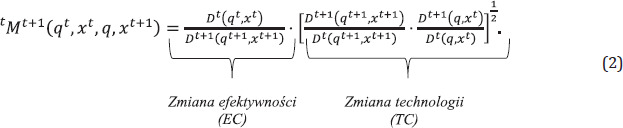
where: Change in efficiency (EC): Measures the change in the distance of the analysed entity from the efficiency frontier during the period under study relative to the previous period.
Change in technology (TC): Reflects the shift in the efficiency frontier itself compared to the previous year, indicating technological progress or regression.
It should be noted that the Malmquist index, despite its popularity, has certain limitations. As pointed out by Martinez and Thorne (2019), among others, it does not satisfy the transitivity condition, which can pose a challenge in long-term analyses.
Furthermore, there are alternative indices, such as the Färe-Primont index, which may offer a different approach to decomposing productivity changes, taking these limitations into account. Despite these considerations, the Malmquist index was chosen for this study due to its widespread use and well-established position in the literature on agricultural productivity research.
The DEA model used in the study is radial, which means that inefficiency is measured by the proportional reduction of all inputs at a given level of outputs. This approach is standard in TFP analyses, but it should be noted that radial models may not fully capture potential slacks in individual inputs and outputs, which are better identified in non-radial models (e.g. SlackBased Measure). The results presented in this article should therefore be interpreted as an approximation of productivity changes, assuming proportional adjustments in inputs.
As mentioned, the output and input distance functions were estimated using the DEA method by solving the corresponding linear programming problems[1]. The study employed an approach based on variable returns to scale (VRS) and input-oriented models – i.e. models assuming that a given output is achieved with the lowest possible level of inputs. The choice of an input-oriented approach was dictated by the assumption that, in the agricultural sector, policymakers and farm managers have greater control over the level and structure of inputs incurred than over the final level of output, which often depends on exogenous factors, such as weather. Furthermore, an input-oriented model is often preferred in the context of analysing resource efficiency.
3.3 Grouping Based on the Decomposition of Malmquist Productivity Indices1
In the first phase of the study, based on panel data covering the years 2007-2023, Malmquist TFP (MQ) productivity indices were estimated and decomposed into indices of changes in efficiency (EC) and changes in technology (TC). Based on the estimated indices, an analysis was conducted of the trajectories of changes in individual indices. For each country, the arithmetic mean of the MQ, EC, and TC indices was calculated. Based on these averages, countries were classified into one of five groups according to their dominant sources of growth, using the following assumptions and algorithm:
Threshold values:
- neutral threshold (1.0) – values in the range of 0.99–1.01,
- growth threshold (1.01) – values >1.01,
- stagnation/decline threshold (0.99) – values <0.99.
For the grouping, an algorithm was used that takes into account a hierarchy of classification criteria consistent with the logic of the Malmquist index decomposition:
- Total factor productivity growth due to technological progress (TC) – countries for which the average MQ value exceeds 1.01, and the average TC value exceeds 1.01.
- Total factor productivity growth due to improvements efficiency (EC) – countries for which the average MQ value exceeds 1.01, and the average EC value exceeds 1.01.
- Stagnation/decline in total productivity – countries for which the average MQ value is lower than 0.99.
- Stable/moderate growth – Other countries that do not meet the above conditions.
- Anomaly – France has been singled out as a special case due to the extreme volatility of its indicators, which prevents it from being reliably classified into the other groups.
The order in which the criteria are applied is important – a country meeting several conditions is placed in the first applicable group. This approach ensures the reproducibility and objectivity of the classification, and the adopted thresholds (1 .01 and 0.99) allow for a clear distinction between countries with significantly different productivity dynamics. A statistical analysis and Kruskal-Wallis tests were also conducted on the identified groups A-E to assess their diversity.
4. Research Results
Based on the estimated Malmquist (MQ) TFP productivity indices and their decomposition into efficiency change (EC) and technology change (TC) indices, five groups of countries were identified according to the adopted algorithm, differing in terms of changes in relative agricultural productivity within the European Union:
Group A (stable countries) – stable/moderate growth (11 countries) – Austria, Czech Republic, Estonia, Finland, Greece, Ireland, Lithuania, Portugal, Slovenia, Spain, Sweden
Group B (efficiency-driven countries) – growth driven by efficiency (EC) (6 countries) – Croatia, Hungary, Poland, Romania, Slovakia, United Kingdom
Group C (technology-driven countries) – Growth driven by technology (TC) (5 countries) – Belgium, Denmark, Germany, Italy, Netherlands
Group D (stagnant countries) – Stagnation/ decline in productivity – (2 countries) – Bulgaria, Latvia
Group E (Anomaly) – France
Table 2 presents the arithmetic mean of the analysed MQ, EC, and TC indices for each group.
Table 2
Average changes in productivity indices for the analysed groups of EU countries for the years 2007-2023
The adopted methodology allowed for grouping countries into clusters that differ not only in the levels of productivity changes but also in the factors influencing those changes. Partial indicators describe the intensity of a single factor’s use but do not indicate whether a change results from improved technology, better management, intensified inputs, economies of scale, etc. They are not a measure of TFP. With a classification based on these assumptions, it is possible to analyse the trends in the partial measures.
4.1 Productivity of Land, Labour, Capital, and Inputs in the Analysed Groups1
After discussing the overall results regarding total factor productivity (TFP), it is appropriate to deepen the analysis by applying partial measures which relate the value of agricultural production to selected production inputs. This approach allows for a better understanding of the structural diversity of agriculture across individual European Union countries and helps identify differences in the sources of productivity advantages. Due to the use of data at current prices, comparisons of indicator levels between countries may partially reflect differences in price levels; therefore, greater emphasis is placed on analysing the dynamics of these indicators and convergence processes.
Partial measures serve a dual function here. First, they enable the identification of the development profile of agricultural holdings – they indicate whether dynamic growth in total factor productivity is based on intensified land use, mechanisation and reduced labour input, capital investments, or the rationalisation of overhead costs. Second, in the subsequent part of the study, they allow us to link the rate of change in TFP to reforms of the Common Agricultural Policy – from the Health Check (2008), through “greening” measures in 2014-2020, to the current CAP framework for 2021-2027, which places strong emphasis on eco schemes and environmental efficiency. At the same time, it should be emphasised that some of the sub-measures used are composite indicators, combining quantity and price components (e.g. output/AWU, output/inputs). Consequently, their trends should be interpreted with caution, as an approximate picture of structural and organisational changes rather than as a direct measure of pure technical progress.
The analysis includes five basic sub-indicators:
Land productivity (value of production per 1 ha of agricultural land),
Labor productivity (value of production per 1 AWU),
Labor intensity (number of AWUs per 1 ha of agricultural land),
Capital productivity (value of production relative to depreciation),
Input productivity (ratio of production to the sum of operating and general costs).
The summary results of the analysis are presented in Table 3.
Table 3
Analysis of partial metrics
The table presents the average levels of agricultural productivity indicators in European Union countries grouped based on the decomposition of the Malmquist index. The analysis shows clear differences between the individual groups. This is also illustrated in Figure 1 after normalising the results.
The differences between the groups are illustrated in Figure 1.
Figure 1
Normalised graph of the analysed sub-indicators of EU agricultural activity for the years 2007-2023
Source: own research.
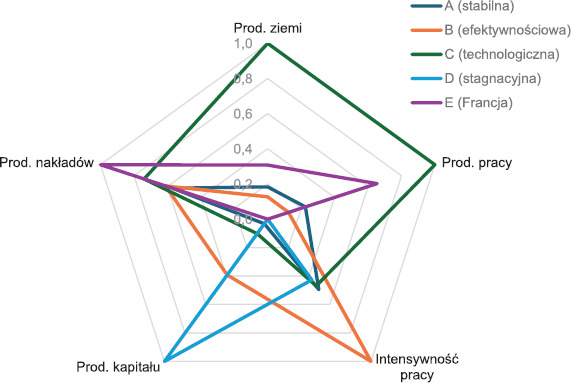
Group A (stable) achieves moderate land productivity (1,810 EUR/ha) and labour productivity (45,062 EUR/AWU). With relatively low labour intensity (0.054 AWU/ha) and moderate capital productivity (6.935) and input productivity (1.574), this is a stable group, with no significant deviations either upward or downward.
Group B (efficiency-oriented) shows lower land productivity (1,489 EUR/ha) and labour productivity (32,704 EUR/AWU) but compensates for this with higher labour intensity (0.082 AWU/ha). It stands out particularly favourably in terms of capital productivity (8,877), as well as a good level of input productivity (1,581), which indicates an efficient use of resources despite lower labour and land productivity.
Group C (technological) is the clear leader in terms of productivity. It achieves the highest indicators for both land (6,518 EUR/ha) and labour (139,084 EUR/AWU), which attests to advanced mechanisation, a high level of technology, and efficient production organisation. Labor intensity remains low (0.052 AWU/ha), typical of highly mechanised agriculture, and input productivity (1.603) is among the highest in the ranking.
Group D (stagnant) is characterised by the lowest results – land productivity is only 755 EUR/ha, and labour productivity at 17,547 EUR/ AWU. Labor intensity (0.050 AWU/ha) is comparable to that of other groups; however, low output combined with a relatively high depreciation value (capital productivity of 12.146) results in an unfavourable efficiency balance. Input productivity (1.478) is the lowest among all groups.
Group E, comprising only France, deserves special attention, as it represents a distinct anomaly. This country has a unique set of variables and requires a separate study. It is characterised by high land productivity (2,527 EUR/ ha) and very high labour productivity (96,992 EUR/AWU) with exceptionally low labour intensity (0.026 AWU/ha). Capital productivity (6.765) remains at an average level, whereas input productivity (1,647) is the highest in the entire ranking, indicating an exceptionally favourable ratio of output to costs incurred.
In summary, Group C leads in technological efficiency, while France (Group E) outperforms other countries in terms of cost efficiency. Groups A and B maintain stable growth – thanks, respectively, to a balanced structure and improved efficiency. The weakest results are observed in Group D, which points to barriers to development and the need to modernise the sector.
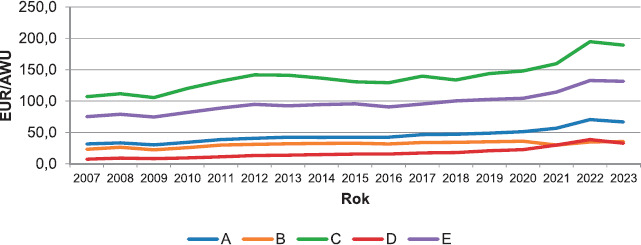
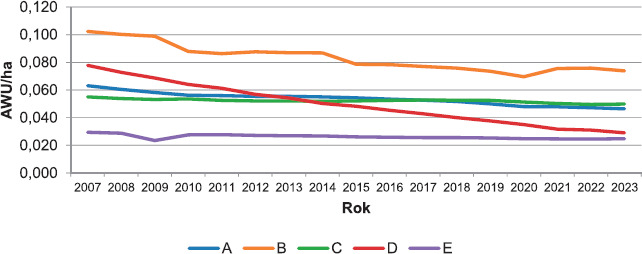
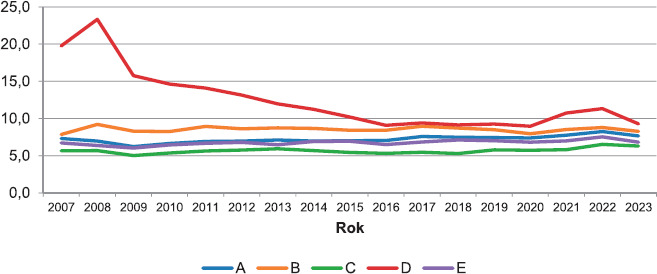
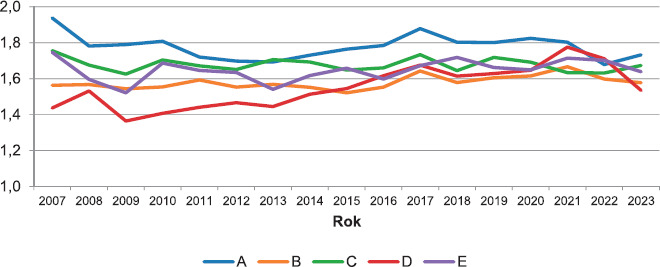
Figures 2-5, in turn, show the trends in the analysed indicators for the years 2007-2023.
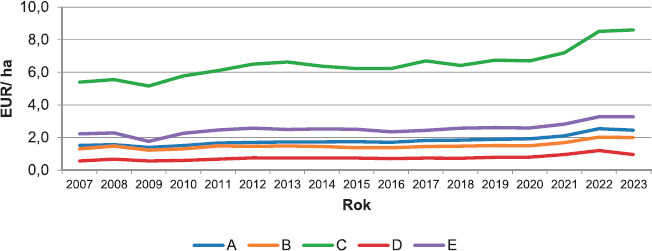
Land productivity increased in all groups. Group C remains the consistent leader, having raised its result from 5.4 to 8.6 thousand EUR/ ha (+60%, with an average growth rate of ≈3%). Groups A and B recorded similar growth rates (≈55-60%), reaching approximately 2.0-2.4 thousand EUR/ha, while France (E) improved by 47% to 3.3 thousand EUR/ha. Group D, despite the highest growth rate (+70%), remains significantly behind (0.95 thousand EUR/ha). The differences in levels between Group C and the other groups persisted throughout the entire analysis period.
In terms of labour productivity (EUR/AWU), Group C recorded the highest and fastest-growing values (189,000 EUR/AWU; +77%), which may indicate that it is maintaining its technological and organisational advantage. France (E) holds second place (132,000; +75%). Group A doubled its result to 67,000 EUR/AWU (+110%) and overtook Group B (36,000; +54%). Group D improved by as much as 337% but from a very low baseline and still lags behind (33,000). The gap between C/E and the rest of the market remains significant.
In terms of labour intensity (AWU/ha), the indicator decreased across all groups, reflecting ongoing mechanisation. The sharpest declines were observed in Group D (-63%) and Group B (-28%). In 2023, group B still exhibits the highest labour intensity (0.074 AWU/ha), while France (E) is extremely mechanised (0.025). Convergence toward lower labour input is evident.
Capital productivity. In Group D, the index fell by half (19.8 → 9.3), shifting from an extremely capital-efficient position to an average position. In the other cases, Group B maintains its leading position (8.27; +5%), while Groups A and C recorded moderate growth. France (E) remains stable (~6.8). Overall, there is a levelling of capital productivity levels, with a marked deterioration in Group D.
Input productivity. Values fluctuate between 1.6 and 1.8, and changes are relatively minor. Groups A, C, and E recorded slight declines (-6 to -11%), Group B remained virtually unchanged, and D improved its ratio by 6.8%. The ranking in 2023 is similar: A (1.73) > E (1.64) > C ≈ D (1.67–1.53) > B (1.58). This indicates that the gap in input efficiency across the EU is narrowing.
Overall, the analysis confirms that Group C consistently leads in terms of land and labour productivity, while Group B is catching up mainly through improved allocation of costs and capital. Group A maintains moderate, steady growth, and France represents a rather unique combination of high labour productivity and strong cost efficiency. Group D – despite several spectacular percentage growth rates – remains the weakest in terms of overall performance, which confirms the need for further modernisation efforts.
4.2 The Relationship Between Key CAP Reforms and Productivity Trends (2007-2023)1
An assessment of changes in agricultural productivity across European Union Member States requires consideration not only of endogenous factors, such as agricultural structure, technological level, and market access, but also institutional factors, including, above all, the evolution of the Common Agricultural Policy (CAP).
This chapter analyses the correlation between changes in agricultural productivity and successive stages of CAP reforms. It should be emphasised that the presented considerations are exploratory in nature and are based on a comparison of productivity trends with the reform timeline rather than on a formal cause-and-effect analysis. These conclusions should be treated as research hypotheses serving as a basis for further, in-depth econometric analyses. An attempt was made to answer the question: Did the successive stages of CAP reforms influence changes in agricultural productivity in EU countries, and how did differences manifest between groups of countries with varying production structures and development trajectories?
During the period 2007-2023, three landmark reforms took place in nature, the effects of which were reflected in the dynamics of total factor productivity (TFP):
Health Check (2008) – this represented a deepening of the so-called Luxembourg reform, continuing the process of decoupling subsidies from production and introducing greater flexibility in direct payments. Loosening the link between the amount of support and the level of production gave farmers the opportunity to allocate resources more rationally, thereby promoting improved technical efficiency.
The 2014-2020 reform (“greening”) – introduced new environmental requirements (crop diversification, maintenance of permanent grassland, and ecological focus areas – EFAs) in response to growing public expectations regarding sustainable development and climate protection. However, this reform was accompanied by controversy regarding its impact on production efficiency: some studies point to a slowdown in the growth rate of total factor productivity (TFP) in intensive-production countries.
The New CAP 2021-2027 – based on the 2018 reform – introduces a system of strategic plans and a clear shift in emphasis toward eco-schemes and the carbon economy. This phase initiated a process of deeper internalisation of climate and social objectives into agricultural policy, which creates new conditions for shaping farm productivity and competitiveness.
The presented results indicate not only varying productivity dynamics among country groups (A-E) but also differing sensitivities of national agricultural systems to CAP regulatory impulses. Of particular importance here is the so-called “catching-up” effect, which helps explain why some Central and Eastern European countries improved their efficiency performance despite a relatively lower initial level of productivity.
4.2.1. Health Check 2008
The 2008 reform completed the decoupling of payments from production, introduced modulation (the transfer of a portion of subsidies to the second pillar), and tightened standards and cross-compliance requirements. After comparing the average ex-ante (2007-2008) and ex-post (2009-2013) indices, it can be concluded that:
Group C (technology-driven countries) increased its average TC by ≈ 4 p.p., suggesting that the liberalisation of production decisions was channelled into capital and technology investments,
Group B (efficiency-driven countries) increased EC by ≈ 3 p.p., which corresponds to the inflow of modernisation funds from the second pillar,
Group D (Bulgaria, Latvia) saw declines in both MQ and TC (decrease > 2 p.p.) – limited absorption of aid and a low capital base neutralised the Health Check incentives,
Group A remained nearly neutral, confirming “moderate growth” based on incremental management improvements.
Conclusion: The observed changes suggest that the decoupling of payments from production in 2008 may have benefited countries with high investment capacity (Group C) and those that quickly restructured their cost structures (Group B), whereas in peripheral countries (Group D), potential benefits may have been limited by a weaker capital base and lower absorption of support.
4.2.2. The 2014–2020 Reform (greening)
“Greening” made 30% of basic payments conditional on the implementation of pro-environmental practices (maintenance of ecological focus areas and good agricultural and environmental conditions, diversification). An analysis of the 2014-2020 period indicates that:
in Group C, the growth rate of TC declined (average TC ≈ 1.017 compared to 1.027 before 2014), and EC did not increase – the costs of meeting environmental requirements tempo-rarily limited technological expansion,
in Group B, EC remained high (≈ 1.02) despite “green” redistribution, which can be linked to the intensive use of the Rural Development Program (PROW) for rural development and farm modernisation,
Group A maintained MQ close to unity (1.003) – greening discipline was offset by a moderate improvement in organisation,
Group D showed a slight improvement in TC (from 0.978 to 0.983), which confirms the hypothesis that environmental subsidies act as a “second bonus” for lagging economies if they have the institutional capacity to absorb the funds.
Conclusion: Greening was associated with a more pronounced differentiation in growth mechanisms – in technology-leading countries, a slowdown in the rate of TC growth was observed, while in catching-up countries, a sustained improvement in EC was noted, which is consistent with the hypothesis that different groups of countries have varying sensitivities to new environmental requirements.
4.2.3. The New CAP 2021-2027 (Preliminary Analysis)
The new programming period shifts the focus from direct payments to results (Performance Framework) and eco-schemes (at least 25% of the Pillar I budget). Data from 2021-2023 indicate that:
Group C is rebuilding its TC (averaging 1.06 in 2022-2023) thanks to the rapid commercialisation of digital and precision solutions (drones, VRT),
Group B maintains a positive EC (≈ 1.04) and records the highest increase in MQ among all groups (+1.3 p.p. y/y 2022/2021) – this points to a growing catch-up effect supported by subsidies for small and medium-sized farms,
The French anomaly (Group E) remains unstable but records an increase in TC (0.47 → 0.94) in 2023 following a sharp decline in 2022,
Group D continues to hover around stagnation, as illustrated by the low uptake rate of eco-schemes (according to EC reports, 2024 < 40% of eligible farmland).
Conclusion: Although the observation period is short, the observed changes are consistent with the hypothesis that the resulting CAP model – 2027 may promote productivity convergence (B > A) and help leaders (C) maintain their technological advantage, while the risk of the gap widening in countries with low absorption capacity (D) persists.
4.3 Structural Analysis and the Catch-up Effect1
4.3.1. Correlations Between Structural Characteristics and Productivity Growth
Based on the data, correlations between structural variables and the long-run average MQ (2008-2023) were estimated:
agricultural land area (a proxy for farm size): r ≈ +0.62 – confirms the thesis that larger scale promotes TFP growth, especially following the Health Check liberalisation,
labour intensity (AWU/ha): r ≈ -0.20 – the negative relationship indicates that faster-growing countries are reducing live labour inputs in favour of machinery and ICT,
capital productivity (depreciation/ha): r ≈ +0.13 – positive but weak, suggesting that capital volume alone is insufficient without complementary organisational changes,
land productivity in the base year: r ≈ +0.12 – a positive but modest relationship, implying that initial productivity does not determine the subsequent growth rate (the trajectory of modernisation is crucial).
Interpreting these correlations requires consideration of the broader institutional and political context. This study is limited to describing the interrelationships between structural characteristics and the long-term dynamics of MQ; the directions and strength of the impact of individual CAP instruments should be the subject of separate econometric analyses.
4.3.2. The Catching-Up Effect
When comparing the dynamics of MQ in countries characterised by relatively low values of sub-indices and efficiency indices in the base year 2007 (including Bulgaria, Romania, Latvia, and Poland) with the group of leaders (Belgium, Denmark, the Netherlands, and Germany):
the average annual growth rate of MQ from 2008 to 2023 was 1.6% in the weaker group versus 0.9% in the stronger group,
the difference in the land productivity ratio decreased from ~5.7-fold to ~3.3-fold,
β convergence test (panel fixed-effects): coefficient -0.18 (p < 0.05), indicating statistically significant catch-up.
The selection of these countries as the “weaker group” was based on their position in the distributions of land and labour productivity indices and their level of technical efficiency in the base year. The catch-up effect, however, is heterogeneous: EC-oriented countries (Group B) benefit more (Poland, Romania) than stagnant countries (Group D). The following factors prove to be key: absorption of Rural Development Program (RDP) funds, the pace of structural changes (land consolidation, modernisation of the machinery fleet), and the ability to meet growing environmental requirements after 2015.
5. Conclusions and Recommendations
5.1 Summary of Main Findings1
The analysis of agricultural productivity in European Union countries for the years 2007-2023, based on the decomposition of the Malmquist index, identified distinctly different trajectories of total factor productivity (TFP) changes. Based on the average values of the MQ indices, EC, and TC, five groups of countries were identified, differing both in the rate of productivity change and in the dominant sources of that growth.
Countries classified in the technological group (C) were characterised by the highest rate of TFP growth, resulting primarily from positive technological changes (TC). In the efficiency group (B), however, productivity growth was driven mainly by improvements in technical efficiency (EC), which may indicate the significant importance of reorganisation processes and the rational use of resources. Group A exhibited moderate, stable TFP growth, whereas stagnant countries (D) were characterised by low growth rates in both efficiency and technology. France was identified as a special case due to the high volatility of its indicators.
An analysis of the component indicators revealed significant differences in the levels of land, labour, and capital productivity among the groups of countries. At the same time, these results confirm that the component indicators are not measures of TFP but rather reflect the structure of the use of individual factors of production, including the degree of mechanisation, labour intensity, and cost relationships.
During the period under study, a catch-up effect was also observed, consisting of a relatively higher rate of TFP growth in countries with lower initial productivity levels, although this process varied and did not affect all countries to the same extent.
The results obtained should be interpreted as a description of the diverse mechanisms of productivity changes in EU agriculture rather than as a basis for formulating unambiguous assessments of the effectiveness of individual agricultural policy instruments.
5.2 Interpretation of Results and Possible Directions for Further Analysis1
The following considerations are interpretive and exploratory in nature. They do not constitute direct normative recommendations for the Common Agricultural Policy but rather an attempt to organise the observed differences among EU countries and identify areas requiring further investigation. In particular, the results of the analysis do not allow for an unambiguous attribution of the observed changes in productivity to specific CAP instruments.
The results obtained primarily point to significant variation in the mechanisms driving productivity growth in agriculture across EU Member States. In some countries, technological progress plays a dominant role, while in others, improvements in technical efficiency or structural changes are key. For this reason, the key conclusion drawn from the analysis is not to identify specific policy solutions but rather the need to identify which growth drivers are at work in individual countries and groups of coun-tries and to what extent they can be strengthened within the framework of future iterations of the Common Agricultural Policy.
This approach implies the need for further, in-depth research – in particular, cause-and-effect analyses – to distinguish the impact of CAP reforms from other endogenous and exogenous factors shaping agricultural productivity in the European Union.
5.3 Limitations of the Study and Directions for Further Analysis1
The analysis was based on Eurostat data, the scope of which – though broad – does not cover all dimensions of production quality (e.g. organisational innovation, environmental value added). Additionally, the DEA methods and Malmquist indices used do not account for price relationships, which limits the assessment of cost competitiveness in market terms. Another limitation is that variables expressed in monetary units were used at current prices, meaning that the growth rates of some indicators may reflect both quantitative changes and differences in price levels across countries and over time. Due to the sample size and time constraints of this phase of the study, a common deflation procedure based on uniform deflators for all countries was not applied. Future analyses plan to incorporate deflated data, which will allow for a more complete separation of real effects from price effects. Limitations also apply to the measurement tools used – the Malmquist index and the radial DEA model. The Malmquist index does not satisfy the transitivity condition, and radial models may not capture all forms of “slack” inefficiencies. Furthermore, the analysis of the relationships between CAP reforms and TFP dynamics was descriptive in nature and did not include a formal assessment of the policy’s impact (e.g. using panel models). For this reason, the conclusions presented regarding the role of the CAP should be treated as working hypotheses and a starting point for further, in-depth research. Another important limitation is the relatively short observation period for the new CAP (2021-2023), which does not yet allow for definitive conclusions to be drawn.
Areas for further research should also include:
integrating productivity studies with assessments of emissions and the environmental footprint (e.g. eco-efficiency),
an in-depth microeconomic analysis at the farm level in selected countries,
and an examination of the long-term effects of climate policy in the context of the Green Deal and the “Farm-to-Table” strategy.
A detailed description of the method for estimating unknown parameters of the distance function can be found, for example, in (O’Donnel 2011).