


Introduction
Input-output analysis represents one of the foundational instruments for assessing the structural organisation of national economies: it allows for a quantitative description of how a unit change in final demand is transformed, through the system of inter-industry linkages, into an aggregate increment of gross output. Among the indicators derived from this framework, the output multiplier occupies a particularly important position. It is interpreted simultaneously as a characteristic of the depth of national production chains, the degree of vertical integration of an economy, and its embeddedness in global value-creation networks. Under the current conditions of a profound structural transformation of the European production space – driven by pandemic-related disruptions, the energy crisis, and the reconfiguration of global supply chains – the analytical value of multiplier estimates is steadily increasing: they provide an empirical basis for a wide range of managerial and strategic decisions.
Quantitative estimates of the output multiplier are valuable for a broad range of users – from national and regional public administration bodies to the private sector, including transnational corporations, institutional investors, industry associations, and regional development agencies. The breadth of these potential applications generates the need for accurate, comparable, and methodologically transparent estimates of the multiplicative potential of national economies of different structural types.
International comparisons performed on a homogeneous methodological basis for economies with fundamentally different types of structural organisation are particularly informative. The triad of Germany, Poland and Slovakia provides a representative reference frame, encompassing a large mature high-technology economy, a relatively large Central European economy with a long history of market transformation, and a small open economy deeply embedded in transnational corporate networks of the automotive and electronics industries. The markers identified on the basis of this triad may serve as reference points in the analysis of the structural potential of other economies of analogous types – transitional, post-transformational, resource-dependent, or integrated into regional production networks.
A systemic gap can nevertheless be observed in the existing literature: there is a lack of comprehensive comparative assessments that simultaneously address the three analytically distinct characteristics of the multiplier – its absolute magnitude, its requirements-based composition in terms of first-round domestic direct inputs and the remaining domestic output requirement, and the scale of multiplicative leakages as a measure of structural openness. The majority of studies are confined to the first dimension, which makes it impossible to distinguish the structural type of an economy from the mere size of its production complex. An equally significant gap is the limited use of composite multiplier indicators for the comparative diagnosis of production-linkage structures in economies occupying different positions in European value chains.
The scientific novelty of the article lies in treating the output multiplier not as a single aggregate indicator, but as a composite structural characteristic that simultaneously combines the domestic multiplier level, its requirements-based decomposition into first-round domestic direct inputs and the remaining domestic output requirement, and multiplicative leakages. This makes it possible to identify not only the scale of domestic production response to final demand, but also the degree to which this response is localised inside the national production system or transmitted abroad through imported intermediate inputs. The aim of the article is to provide a comprehensive comparative assessment of the output multiplier in the economies of Germany, Poland and Slovakia using the 2022 OECD input-output tables and, on this basis, to identify exploratory comparative markers of the structure of production linkages in economies of different openness and production-network positions. The research hypothesis states that selected export-oriented high-technology and medium-high-technology sectors in smaller and more open economies tend to exhibit higher multiplier leakages and weaker localisation of intermediate consumption than comparable sectors in Germany; lower domestic multiplier values are expected in several, but not necessarily all, such sectors.
Literature review
The study of multiplicative effects within the system of national production linkages has occupied one of the central positions in economic analysis since the formation of the input-output methodology by W. Leontief. Constructed on the basis of the Leontief inverse matrix, the output multiplier has undergone substantial methodological evolution over recent decades – from the basic model of an aggregated multiplier to more elaborate analytical constructs that incorporate structural decomposition and network analysis, the effects of national participation in global value chains, and the distinction between the domestic and total components of the multiplier. The contemporary synthesis of this apparatus is presented in fundamental works combining methodological rigour with applied orientation (Dietzenbacher et al., 2013; Miller & Blair, 2022; ten Raa, 2017), in methodological handbooks on supply-use and input-output tables (United Nations, 2018), and in the literature on Rasmussen-Hirschman backward and forward linkages (Cai & Leung, 2004; Sonis et al., 1995; Temurshoev, 2010). The further development of this strand has been driven by the emergence of multi-country inter-industry databases, which have made it possible to conduct systematic cross-country comparisons on a homogeneous methodological basis (Timmer et al., 2015; Tukker & Dietzenbacher, 2013; OECD, 2025).
Applied research in recent years has demonstrated a shift in focus from aggregate estimates to a structural interpretation of differences between economies with distinct types of integration into global production networks. It has been shown that, even on a homogeneous methodological basis, the magnitude of the output multiplier in a given sector depends substantially on the depth of national supply chains, the technological complexity of products, and the scale of national involvement in transnational corporate networks (DePaolis et al., 2022; Liu & Shi, 2020; Marquez Mendoza, 2023). Contemporary structural decomposition studies further refine this dependence by quantitatively distinguishing changes in the multiplier driven by technological shifts from those caused by import substitution of intermediate consumption (Ueda, 2022; Wang et al., 2017). Separate strands of research are devoted to network analysis of inter-industry linkages, complementing classical multiplier estimates by identifying the centrality and structural vulnerability of economic activities (Cerina et al., 2015; McNerney et al., 2022), and to the influence of global value chains on the formation of national multiplicative effects, particularly in the context of production fragmentation (Los et al., 2015; Acemoglu et al., 2012).
Of particular theoretical and applied importance is the methodological distinction between the domestic and total output multipliers. The domestic multiplier captures only that part of the aggregate effect which is realised within the national production system, whereas the total multiplier also includes the imported component of intermediate consumption. The relative difference between these two values – multiplicative leakages – measures directly that share of the potential effect which is realised beyond the national borders, and serves as an adequate indicator of a sector’s structural openness (Los et al., 2015; Tukker & Dietzenbacher, 2013). Empirical applications of this distinction span the analysis of structural openness in large open economies (Cerina et al., 2015; McNerney et al., 2022) and Central European economies with varying levels of integration into European production networks (Cieślik et al., 2016; Gurgul & Lach, 2018), as well as the identification of structural vulnerabilities in transitional economies (Heyets, 2023; Haddad et al., 2023; Yastremskii, 2020; Yastremskii & Kulyk, 2021).
Despite this well-developed methodological foundation, the existing literature reveals a systemic gap: there is a shortage of comprehensive cross-country comparative assessments of the output multiplier conducted on a homogeneous basis and simultaneously addressing the three analytically distinct characteristics of the indicator – its absolute magnitude, internal composition, and scale of multiplicative leakages (Cieślik et al., 2016; Gurgul & Lach, 2018; Marquez Mendoza, 2023). Exploratory comparative markers that would operationalise composite multiplier analysis for economies occupying different positions in European production networks are likewise insufficiently developed (DePaolis et al., 2022; Temurshoev, 2010). Bridging these gaps on the basis of the Germany-Poland-Slovakia triad constitutes the objective of the subsequent sections of the article.
Methodology
The study is structured as a sequence of three methodological stages that ensure a complete analytical cycle – from the formation of the information base to the testing of the hypothesis posited in the introduction and the generalisation of results in the form of exploratory comparative markers.
Stage 1. Formation of the information base. The primary data source consists of the OECD input-output tables, 2025 release, with data for 2022. The release provides harmonised national input-output tables for 50 economic activities and allows the empirical analysis to be based on the most recent structurally complete year available in the database. The unit of analysis is an economic activity defined according to the OECD sectoral classification compatible with ISIC Rev. 4. The household-employer sector (T) is reported in the appendix for completeness but is not substantively interpreted as a production-linkage sector. Because the German row for mining of metal ores (B07) is incomplete in the OECD data, it is reported in the appendix but excluded, together with sector T, from the main cross-sectoral averages.
Stage 2. Analytical computations and construction of the system of indicators. For each economy, the OECD database provides two parallel versions of the Leontief inverse matrix, calculated under a uniform protocol: the total Leontief inverse L = (I − A)⁻1, which accounts for the entire intermediate consumption – both of domestic and imported origin – and the domestic Leontief inverse Ld = (I − Ad)⁻1, constructed exclusively on the basis of domestic intermediate consumption, where I is the identity matrix and A and Ad are the matrices of total and domestic direct-input coefficients respectively (Miller & Blair, 2022; United Nations, 2018). This data structure ensures methodological homogeneity of the cross-country comparison.
On the basis of the two parallel versions of the Leontief inverse matrix, the basic multiplicative indicators are calculated by column. The total output multiplier of an economic activity j is defined as the sum of the elements of the j-th column of the total Leontief inverse:
MjT = Σi=1n lij, (1)
where lij are the elements of the matrix L = (I − A)⁻1, and n is the number of economic activities (Miller & Blair, 2022).
The domestic output multiplier of an economic activity j is defined as the sum of the elements of the j-th column of the domestic Leontief inverse:
MjD = Σi=1n lijd, (2)
where lijd are the elements of the matrix Ld = (I − Ad)⁻1.
The direct effect of an economic activity j equals the sum of the coefficients of direct inputs of domestic origin in the corresponding column of the matrix Ad:
DEj = Σi=1n aijd, (3)
where aijd are the elements of the matrix Ad. The requirements-based residual component of the domestic output multiplier, reported in this article as the indirect/residual effect for consistency with multiplier terminology, is calculated as the difference between the domestic multiplier and the first-round domestic direct-input component:
IEj = MjD − DEj, (4)
In this article, IEj is used as a requirements-based residual measure. Because MjD includes the initial unit of output associated with final demand, IEj should not be interpreted as a strict higher-order indirect effect net of the initial output component. A strict higher-order indirect requirement would be obtained at the matrix level as Ld − I − Ad. The present residual instead measures the remaining domestic output requirement after first-round domestic direct inputs and is used to characterise the internal composition of the domestic multiplier (Miller & Blair, 2022; United Nations, 2018; Bureau of Economic Analysis, 2009). On the basis of fundamental quantities (1)-(4), a sequential system of structural-analytical indicators is calculated. The first indicator is the absolute value of the domestic output multiplier MjD across the OECD economic activities available for 2022. The second indicator is the share of the indirect/residual component in the total value of the domestic output multiplier, which characterises the requirements-based composition of the multiplier effect:
where SjIE is the share of the indirect/residual component in the total value of the domestic output multiplier of an economic activity j, %; IEj and MjD are the indirect/residual component and the domestic output multiplier respectively (formulas (4) and (2)).
The third indicator is the relative gap between the total and the domestic output multipliers, interpreted as a measure of multiplicative leakages:
where Lj is the multiplicative leakages of an economic activity j, %; MjT and MjD are the total and the domestic output multipliers respectively (formulas (1) and (2)).
Stage 3. Structural systematisation and hypothesis testing. At this stage, the results are generalised through the grouping of economic activities according to two criteria simultaneously: their belonging to patterns common to all three economies, and country-specific features associated with a mature, post-transformation or small open economy. The hypothesis is tested by comparing domestic output multipliers MjD and multiplicative leakages Lj in selected high-technology and medium-high-technology activities. In this formulation, the hypothesis is considered supported if such sectors in Poland and Slovakia exhibit higher leakage rates and weaker localisation of intermediate consumption than comparable sectors in Germany, while lower domestic multiplier values are treated as a sector-specific, not universal, manifestation of this structural pattern.
Results
The empirical analysis of the output multiplier in the economies of Germany, Poland and Slovakia is structured according to the logic of progressive deepening – from the absolute values of the indicator to its requirements-based composition, then to the scale of multiplicative leakages, and finally to the structural systematisation of the identified patterns in the form of exploratory comparative markers.
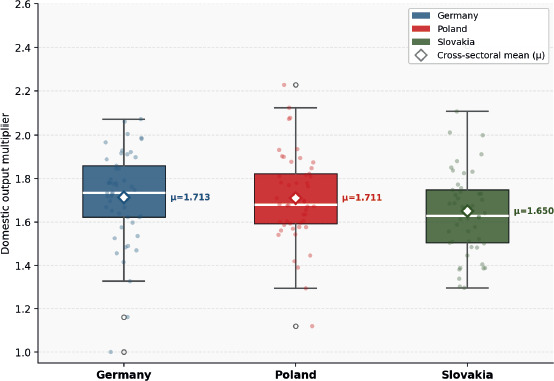
The results of the first stage of the 2022 analysis show that the absolute values of the domestic output multiplier across the comparable set of economic activities (the full data are presented in Table A1 of Appendix A) form a nuanced cross-country configuration. The cross-sectoral mean of the domestic output multiplier amounts to 1.713 units of output per unit of final demand in Germany, 1.711 in Poland and 1.650 in Slovakia. The corresponding mean values of the first-round domestic direct-input component equal 0.420, 0.410 and 0.372, while the mean values of the indirect/residual component amount to 1.308, 1.301 and 1.278 respectively. Germany and Poland are close at the aggregate multiplier level, whereas Slovakia remains measurably lower.
The standard deviation of the domestic multiplier is also similar across the three countries (0.24 in Germany, 0.23 in Poland and 0.23 in Slovakia), indicating comparable sectoral heterogeneity. However, the range and location of sectoral extremes differ. In Germany the highest value is observed in air transport (H51, 2.07), followed by iron and steel (C24A, 2.06), food products, beverages and tobacco (C10-12, 2.01), warehousing and support activities for transportation (H52, 1.99), paper products and printing (C17-18, 1.98), and wood products (C16, 1.97). In Poland the upper pole is formed by food products, beverages and tobacco (C10-12, 2.23), air transport (H51, 2.12), construction (F, 2.08), wood products (C16, 2.07), other non-metallic mineral products (C23, 1.94), warehousing (H52, 1.93), iron and steel (C24A, 1.90), agriculture (A01, 1.90) and water transport (H50, 1.90). In Slovakia, the highest values are concentrated in electricity supply (D, 2.41), air transport (H51, 2.11), arts, entertainment and recreation (R, 2.01), other mining and quarrying (B08, 2.00), iron and steel (C24A, 1.91), wood products (C16, 1.88), paper products and printing (C17-18, 1.85), warehousing (H52, 1.84), other non-metallic mineral products (C23, 1.83), and food products, beverages and tobacco (C10-12, 1.83).
Alongside the identified differences, a common high-multiplier pattern can be observed in all three economies. The threshold of 1.80 is simultaneously exceeded by food products, beverages and tobacco (C10-12), wood products (C16), paper products and printing (C17-18), other non-metallic mineral products (C23), iron and steel (C24A), air transport (H51), and warehousing (H52). The 2022 data show that the common high-multiplier group includes several material-intensive manufacturing branches in addition to food-and-logistics activities. This suggests that the common upper pole of the multiplier landscape is formed by activities combining a large intermediate input base with strong domestic supplier involvement.
The German economy retains the exploratory marker of a mature production system through the presence of high domestic multipliers across three functionally different segments simultaneously. In material-intensive manufacturing: iron and steel (C24A – 2.06), non-ferrous and precious metals (C24B – 1.92), fabricated metal products (C25 – 1.85), motor vehicles (C29 – 1.85). In infrastructure and utility activities: water supply (E – 1.91), construction (F – 1.89). In logistics and communications: air transport (H51 – 2.07), warehousing (H52 – 1.99), postal and courier activities (H53 – 1.90), telecommunications (J61 – 1.92). This simultaneous presence of high multiplier values across functionally diverse segments distinguishes Germany from Poland and Slovakia, where the highest multipliers are concentrated in narrower activity groups.
The Polish economy exhibits a strong multiplier profile close to Germany at the aggregate level, but with a different internal structure. Its high-multiplier group is dominated by consumption, resource, construction and infrastructure-related activities: food products, beverages and tobacco (C10-12, 2.23), construction (F, 2.08), wood products (C16, 2.07), agriculture (A01, 1.90), water transport (H50, 1.90), paper products and printing (C17-18, 1.88), other mining and quarrying (B08, 1.85), land transport (H49, 1.82), electricity supply (D, 1.82), extraction of crude petroleum and natural gas (B06, 1.81), and water supply (E, 1.81). Export-oriented manufacturing activities such as computer, electronic and optical products (C26, 1.67), electrical equipment (C27, 1.66), machinery and equipment (C28, 1.59), and motor vehicles (C29, 1.71) are located around the cross-sectoral mean.
The Slovak economy remains the clearest example of a small open production system. The 2022 data show a differentiated pattern: very high multipliers are observed in electricity supply (D, 2.41), air transport (H51, 2.11), arts, entertainment and recreation (R, 2.01), other mining and quarrying (B08, 2.00), iron and steel (C24A, 1.91), wood products (C16, 1.88), paper products (C17-18, 1.85), warehousing (H52, 1.84), other non-metallic mineral products (C23, 1.83), and food products, beverages and tobacco (C10-12, 1.83). At the same time, several export-oriented or technologically more complex manufacturing activities remain substantially constrained by leakages: motor vehicles (C29, 1.40), electrical equipment (C27, 1.51), basic pharmaceuticals (C21, 1.39), and coke and refined petroleum products (C19, 1.38). Computer, electronic and optical products (C26, 1.70) are above the Slovak average (see Figure 1).
Figure 1
Distribution of the domestic output multiplier across economic activities in Germany, Poland and Slovakia, 2022
Source: author’s own calculations based on OECD Input-Output Tables (2025 edition, data for 2022).
The results of the second stage of the study, focused on the requirements-based composition of the multiplier effect (the full data are presented in Table A2 of Appendix A), show that the share of the indirect/ residual component in the domestic multiplier remains relatively stable across the three economies. For the comparable set of activities, the mean value of the indicator amounts to 76.1% in Germany, 76.5% in Poland and 77.9% in Slovakia. These values indicate that the residual component is numerically larger than the first-round domestic direct-input component in all three economies; this finding should be interpreted according to the definition in formula (4), because the residual includes the initial output component.
The highest values of the indicator are observed mainly in activities with low material intensity and a small share of intermediate consumption in output: education (P: 84.9; 86.8; 87.0%), real estate activities (L: 83.0; 75.6; 83.9%), human health and social work (Q: 80.7; 79.1; 84.4%), and public administration (O: 79.7; 84.0; 82.1%) for Germany, Poland and Slovakia respectively. In these activities, the high share of the indirect/residual component does not by itself indicate strong supplier-chain depth; it reflects the comparatively low value of the first-round domestic direct-input component.
A different interpretation is needed for material-intensive manufacturing. In Slovakia, the share of the indirect/residual component reaches 83.0% in motor vehicles (C29), 83.6% in coke and refined petroleum products (C19), and 79.9% in electrical equipment (C27). In these sectors, a high share of the residual component coexists with elevated leakages, indicating that a large part of intermediate consumption is imported rather than sourced domestically. The indicator should therefore be read jointly with the leakage data.
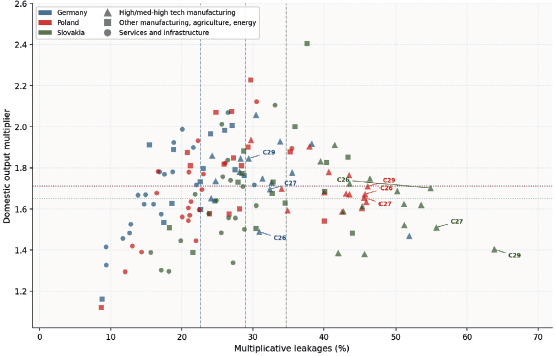
In the concluding stage of the empirical analysis, the domestic and total output multipliers are juxtaposed and the relative gap between them is calculated (the full data are presented in Table A3 of Appendix A). For the comparable set of activities, the mean gap amounts to 22.6% in Germany, 29.0% in Poland and 34.7% in Slovakia. For the indirect/residual component, the corresponding mean gaps equal 22.1%, 29.3% and 34.9%. Thus, the 2022 data confirm a clear stepwise gradation of multiplicative leakages from Germany to Poland and Slovakia.
The structure of leakages across economic activities reveals that the most informative distinction between the three economies lies not in the absolute multiplier level, but in the degree to which the multiplier effect is retained domestically. In computer, electronic and optical products, electrical equipment, machinery and equipment, and motor vehicles, leakages range from 28-32% in Germany, 43-46% in Poland and 51-64% in Slovakia. The moderate leakage levels in Germany for these sectors (C26 – 30.9%, C27 – 32.4%, C29 – 29.4%) are consistent with the broad domestic multiplier base identified in Stage 1. In particular, the leakage rate reaches 63.83% for Slovak motor vehicles, 55.69% for Slovak electrical equipment and 54.86% for Slovak computer, electronic and optical products. This pattern provides empirical evidence consistent with the proposition concerning asymmetric integration into European high-technology and medium-high-technology value chains.
A symmetrical regularity is the concentration of the lowest leakages in activities tied to the national territory and not amenable to full import substitution: education (P: 9.38; 12.04; 17.10%), real estate activities (L: 9.35; 16.67; 15.64%), public administration (O: 12.82; 14.34; 19.86%), and human health and social work (Q: 11.70; 20.93; 27.22%) for Germany, Poland and Slovakia respectively. Resource-and-energy activities form a separate pattern: coke and refined petroleum products (C19) are characterised by very high gaps in all three countries (Germany – 51.87%, Poland – 45.35%, Slovakia – 45.72%), reflecting systemic dependence on imported energy resources rather than the general structural type of the economy alone (see Figure 2).
Figure 2
. Domestic output multiplier vs multiplicative leakages by economic activity and country, 2022
Source: author’s own calculations based on OECD Input-Output Tables (2025 edition, data for 2022).
The generalisation of the identified regularities through the grouping of economic activities according to two criteria – belonging to a pattern common to all three economies and country-specific features – is presented in Table 1.
Table 1
Structural groups of economic activities by the level of the domestic output multiplier: common patterns and country-specific markers
The systematisation of the obtained results reveals a key feature of the 2022 multiplier landscape: the upper pole is now formed not only by food and logistics activities, but also by several material-intensive manufacturing branches common to all three economies. At the same time, the middle group remains the principal field of cross-country differentiation, because it contains many export-oriented manufacturing activities whose domestic multiplier levels may appear similar, while their leakage rates differ substantially.
Drawing on the cumulative comparison across the three stages of analysis, three exploratory comparative markers can be reconstructed. The marker of a mature economy lies in the combination of a broadly diversified high-multiplier base and comparatively moderate leakages. The marker of a post-transformation economy consists in the coexistence of strong nationally integrated resource, construction and infrastructure chains with globally embedded manufacturing segments characterised by higher leakages. The marker of a small open economy consists in the coexistence of selected very high multipliers in infrastructure and material-intensive activities with high leakages and weak localization in export-oriented manufacturing.
The concluding step of the analysis is the verification of the hypothesis. The 2022 data support the hypothesis most strongly in the leakage dimension. In Poland, computer, electronic and optical products (C26) and electrical equipment (C27) have domestic multipliers below the national mean of 1.711 (1.672 and 1.655 respectively), while motor vehicles (C29, 1.710) are practically at the cross-sectoral mean; however, the leakages of all three sectors substantially exceed the Polish average of 29.0%: C26 – 45.78%, C27 – 45.66%, C29 – 46.16%. In Slovakia, motor vehicles (C29, 1.404) and electrical equipment (C27, 1.510) are below the national mean of 1.650, whereas computer, electronic and optical products (C26, 1.702) are above it; yet the leakages of all three sectors are very high against the Slovak mean of 34.7%: C29 – 63.83%, C27 – 55.69%, C26 – 54.86%. By contrast, in Germany the leakages of the same sectors range from 29 to 32%, against a national mean of 22.6%. The hypothesis is thus supported most clearly in the leakage dimension – for all six sector-country combinations examined; in the multiplier-level dimension it is supported for five of six, with computer products in Slovakia being the sole exception.
Discussion and conclusions
The empirical results obtained from the 2022 tables should be interpreted in terms of contemporary theoretical constructs of production fragmentation and the asymmetric distribution of value added in European production networks. The clear gradation of multiplicative leakages in high-technology and medium-high-technology manufacturing – from about 28-32% in Germany to 43-46% in Poland and 51-64% in Slovakia – is consistent with the concept that smaller and more open economies may perform important production functions while retaining a smaller part of the total multiplier effect within the national economy (Los et al., 2015; Timmer et al., 2015). This interpretation is also consistent with the network approach to inter-industry systems (Cerina et al., 2015; McNerney et al., 2022) and with previous studies on Central and Eastern European production linkages (Cieślik et al., 2016; Gurgul & Lach, 2018). The article has made it possible to establish the following principal results. First, the 2022 data show close average domestic output multipliers in Germany and Poland (1.713 and 1.711 respectively) and a lower value in Slovakia (1.650), while the leakage rate increases clearly from Germany (22.6%) to Poland (29.0%) and Slovakia (34.7%). Second, the claim of a universal inverse relationship between technological level and domestic multiplier potential is not supported in its strict form: the evidence is stronger for leakages than for multiplier levels. Third, the share of the indirect/residual component remains high and relatively stable, but its interpretation differs between low-material-intensity services, where it reflects a structurally low first-round direct-input component, and material-intensive manufacturing sectors with high import dependence, where it coexists with elevated leakages. Fourth, the composite analysis makes it possible to identify exploratory comparative markers of mature, post-transformation and small open economies without treating them as universal classification criteria.
The practical value of the results lies in the possibility of using the composite multiplier framework as a reference base for assessing the structural potential of national economies. The 2022 evidence shows that policy and investment priorities should not be based on the absolute domestic multiplier alone. Sectors with similar multiplier values may differ radically in the degree to which the multiplier effect is retained domestically. Therefore, sectoral priorities should be formed by jointly considering the domestic multiplier level, its requirements-based decomposition into first-round domestic direct inputs and the remaining domestic output requirement, and the scale of multiplicative leakages.
The study has certain limitations. The multiplier estimates reflect the structural characteristics of the economies as of 2022 and are based on one empirical year. Since the analysis covers only Germany, Poland and Slovakia, the reconstructed markers should be interpreted as exploratory comparative evidence rather than as a validated typology of national economies. A further limitation is the level of sectoral aggregation in the OECD database at 50 economic activities, which does not make it possible to differentiate detailed product markets. Promising directions for further research include extending the time horizon of the analysis to a multi-year panel and applying the composite methodology to a broader group of European and non-European economies.