1. Introduction
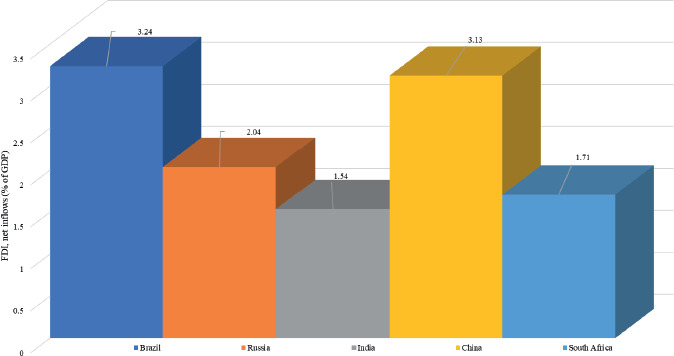
Geopolitics, economics, and the distribution of products have seen significant upheaval in the recent two to three decades. BRICS countries i.e., Brazil, Russia, India, China, and South Africa, are emerging economies that have grown significantly in importance as producers of products and services in the global economy. The five BRICS nations share the traits of having an immense population, a sizable consumer market, rapid economic growth, expansive land areas, etc., which makes them all attractive to investors from all over the globe. All regions experienced growth because of the 2021 Foreign Direct Investment (FDI) recovery. However, affluent countries, whose FDI reached $746 billion – more than double the amount in 2020 – accounted for nearly three-quarters of the global rise. M&A (Merger and Acquisition) transactions and high retained earnings at multinational corporations were the main drivers of the growth. These, in turn, caused enormous intra-firm financial flows and significant FDI swings in significant financial centers. Though they expanded less quickly than those to developed countries, FDI flows to emerging countries nonetheless rose by 30%, to $837 billion. Among BRICS countries from 1997 to 2021, Brazil and China have the highest FDI inflows i.e., 3.24% of their GDP and 3.13% of their GDP respectively, followed by Russia and South Africa. India has the lowest FDI inflows i.e., 1.54% of their GDP (See Figure 1). The increase was mostly brought on by Asia’s robust economic performance, the Caribbean and Latin Americans’ partial recovery, and an upsurge in African countries. The percentage of emerging nations in global flows stayed just above 50 percent (Azémar & Giroud, 2023).
Figure 1
Average FDI net inflows (% of GDP) in BRICS countries from 1997 to 2021
Source: compiled by authors.
Developing nations compete with one another to entice foreign direct investment (FDI), which is a significant source of technical assistance, employment generation, labour skill generation, managerial improvement, export expansion, and enhanced performance in local firms (World Bank, 2013a). By stimulating local dissemination of knowledge and innovation at the industrial, technological, and managerial levels, FDI increases the host countries’ investments and capital production efficiency (Borensztein, Gregorio, and Lee 1998; Balasubramanyam et al., 1999). Impalpable assets, such as technical knowledge and administrative skills, are transferred to the host nation through FDI, which also enhances investment and capital stock and boosts employment by generating new production capacity and jobs. FDI also serves as a source of new organizational technologies, processes, products, and management skills and provides backward and forward economic connections (Ho and Rashid, 2011). Since FDI is a significant part of the global growth engine and there is evidence of a positive relationship between FDI and economic growth, governments work to improve the business environment to draw more FDI into their economies (Bhavan et.al., 2011).
In recent times Global investments in economic progress have been significantly impacted by the conflict in Ukraine. It happens just as a shaky world economy is starting to make an uneven recovery from the pandemic’s ravages. Across the world, safety and humanitarian emergencies, macroeconomic disruptions caused by the war, food and energy price surges, and heightened investor mistrust will all have an impact on global FDI in 2022 and beyond. In order to advance the process of attracting FDI, officials must first recognize the key factors that influence FDI. As a result, many studies on these factors have indeed been conducted. Decision-makers can comprehend the scope and direction of FDI flows owing to these determinants. The present study mainly concentrates on the factors that are majorly causing to entice FDIs in the BRICS countries. Additionally, the current study makes crucial policy suggestions concerning luring FDI.
2. Review of Literature
According to Bhagwati, an export-encouraging approach is more expected than an import-swapping approach to attract a larger volume of FDI and stimulate its better deployment. The neutrality of the export-encouraging trade regime, which is the crucial component of the export-encouraging strategy, prevents the FDI from giving unnatural and temporary incentives. “Simply the conjunction of cheaper prices and the Export encouraging orientation” is the trade regime’s primary inducement for FDI (Bhagwati, 1985). Technological diffusion can occur via a few avenues involving the transmission of ideas and new technology. Imports of high-tech items, acceptance of foreign technology, and acquisition of human resources through diverse channels are unquestionably essential conduits for the international dissemination of technology (Easterly et al., 1994; Mody and Murshid, 2005). Institutional and political factors of FDI are less significant than traditional economic variables. The market-seeking behavior of the investors is the primary driver of FDI in the BRICS countries. Assorted studies have focused on the variables that stimulate the movement of foreign capital in developing economies. The institutional, socio-political, and economic elements of FDI are the main topics of this research. Economic variables consist of market size, labour costs, trade openness, and economic solidity. The market size has been acknowledged as a crucial factor in almost all empirical research that explains FDI drivers (Leitao, 2010; Hailu, 2010; Bhavan, et al, 2011; Aw & Tang, 2010; Ibrahim et al., 2015). FDI in the receiving country is positively correlated with trade openness, as per most of the research. China has attracted a tremendous amount of foreign capital due to its open-door policy (Jiang et al., 2013). However, the effect of openness on FDI varies depending on whether the investment is focused on the domestic or export market (Lankes and Venables, 1996; Sahoo, 2006; Nunes et al., 2006; Bhavan et al., 2011). From 1990 to 1999, 26 Eastern European transitional economies, including the former Soviet Union, received FDI and portfolio investment flows. Common economic characteristics such as market size, fiscal deficit, inflation, currency rate regime, market reforms, trade openness, natural resources availability, investment barriers, risk analysis, and bureaucracy effectively explain FDI flows (Garibaldi et al., 2001). More foreign direct investment will flow into a nation with a stable macroeconomic environment and persistent rates of growth, than the one with more unstable economic conditions. GDP growth rates, the Manufacturing Output Index, the rate of interest, and the rate of inflation are the substitutes used to measure growth rates (Dadush, Dasgupta & Ratha, 2000). While the amount of FDI’s favourable impact on economic growth varies depending on the amount of human capital present in the host economy, generally, FDI is beneficial. However, as the FDI interacts with human capital, it has a direct detrimental impact on nations with meager human capital stock (Cohen 1993; Borensztein, et al., 1998). The host nation benefits greatly from FDI in a variety of significant ways. It increases capital, strengthens the work atmosphere and working conditions, expands industries, produces jobs, fosters the growth of new technologies, and introduces new skills (Haddad and Harrison, 1993; Perez, 1997).
It is expected that in the background of emerging countries in particular, the improved efficiency of FDI would emerge from a mix of more modern managerial skills and advanced technology; FDI may be the primary avenue via which sophisticated technologies are transferred into emerging countries (Graham & Krugman, 1993). Horizontal and vertical FDI are the two rudimentary motivations for investing abroad. Horizontal (or market-seeking) FDI is to serve the local market, whereas vertical (or efficiency-seeking) FDI is to secure low-cost inputs (Shatz and Venables, 2000). A survey of MNCs directors and international professionals recognized rankings of 13 crucial FDI criteria, which showed high priority to labour prices, quality of labour, and political and social stability (Hatem, 1997). According to some studies, it is confirmed that exchange rate depreciation favors FDI (Klein and Rosengren, 1994; Blonigen, 1997; Froot and Stein, 1991). According to certain studies, the link between the currency rate and FDI inflows has also yielded unimpressive results in several researches (Bayoumi and Lipworth, 1998; Campa, 1993). According to some studies, export promotion policies have a more substantial impact on FDI than import-swapping policies (Balasubramanyam et al., 1996). The host countries’ existing capital base and comparative labour costs are crucial considerations when determining new FDI (Ito, 2000; Kiyota and Urata, 2004). According to samples from a study of developing and developed countries, growth ultimately depends on the transfer of knowledge from the investing nation to the receiving nation and the technology spillovers (De Mello, 1999). Analyses of developing economies discovered that political instability considerably affects the FDI (Root and Ahmed, 1979; Schneider and Frey, 1985). A lower political risk and stronger institutional quality are associated with higher FDI inflows, as they reduce uncertainty and enhance investor confidence (Sabir et al., 2019). Effects on FDI inflow in emerging economies vary depending upon the different aspects of the country’s institutional environment (Bhasin and Garg, 2018). In developing economies enduring political stability and reduced political uncertainty enhances FDI attractiveness (Krifa-Schneider & Matei, 2010; Yen et al., 2023). Foreign investment decisions are not considerably impacted by corruptive practices in the host nation, according to data analysis on US corporations (Wheeler and Mody, 1992; Wijeweera and Dollery, 2009). In contrast, it was shown that there was a strong correlation between corruption and foreign direct investment (Wei, 2000). Furthermore, corruption can affect FDI either favorably or unfavorably depending on the nature of the FDI i.e., whether it is a resource-seeking investment or a market-seeking investment (Arif et al., 2020).
Over the period several empirical studies have been conducted in different countries and organizations taking into account several factors that determine the FDI inflows by employing different econometric techniques. These empirical studies along with methods used and results are explained in Table 1. The econometric techniques like Ordinary Least Square (OLS) method was utilized by Anwar, (1999); Bhatt, (2008); Sury, (2008); Mah & Yoon (2010) and Iqbal et al., (2018). Fixed effect and Random effect model were employed by researches such as Onyeiwu and Shrestha, (2004); Bhatt, (2008); Mottaleb and Kalirajan, (2010); Eregha, (2019) and Eissa and Elgammal, (2020). Causality test, Vector Error Correction Mechanism (VCEM), and Auto-Regressive Distribution Lag (ARDL) model were utilized by Ravinthirakumaran et al., (2015); Yosoff & Nuh, (2015); Pacific, (2017); Tuffour & Mensah, (2018) and Rai & Sharma, (2020). Additionally, model like Factor analysis and Discrimination analysis was used by Jackson & Markowski, (1996), Principal Component Analysis was used by Bhasin & Garg, (2020). Despite so many empirical studies the role of political risk and institutional variables was not clearly reflected in the results. The current study incorporates the political risk variables and institutional variables along with other macroeconomic variables to check whether these variables significantly determine the FDI inflows in the BRICS countries.
Table 1
Empirical studies
3. Material and Method
Individual heterogeneity is controlled for by panel or longitudinal data, but not by time-series or cross-section data, which increases the possibility of skewed conclusions. Moreover, panel data can recognize quantity effects that are hidden in only cross-sectional or time-series data. Due to its superiority above cross-sectional and time series data, the study assesses the data by combining time series and cross-sectional (Panel or longitudinal) data. It uses every piece of information accessible, which cannot be seen in cross-sections or time series. Panel or Longitudinal data has been utilized in this work from 1997 to 2021. Brazil, South Africa, Russia, India, and China are the nations being studied. Important FDI-determining factors included in this research are RoE (Exchange Rate), TOP (Trade Openness as a percentage of GDP), INFL (Inflation Rate), GFCF (Gross Fixed Capital Formation), PSNV (Political Stability and Non-Violences), GE (Government Effectiveness), CoC (Control of Corruption), RoL (Rule of Law), RQ (Regulatory Quality), HC (Human Capital as School enrollment, tertiary, % gross), GDP growth (annual %) (see Table 2).
Table 2
Variable description
Regression equation for the current study is as follows,
where: Yit is the dependent variable for entity i at time t, αi is the entity-specific intercept that captures the effect of time-invariant unobserved heterogeneity across entities, it is the time-varying independent variables for entity i at time t, β are the coefficients that represent the effect of each independent variable on the dependent variable, eit is the error term that represents the random variation in Yit that is not explained by the independent variables. Using the dependent and independent variables in equation 1 we get equation 2 i.e.,
(2)
The study does not suffer from multi-collinearity problems among the regressors (Mean VIF= 4.87). Fixed effect and Random Effect tests have been conducted to conduct the panel regression. Choosing between the two models by assuming the differences in coefficients is not systematic. So, Hausman test results reject the null hypothesis (Prob > chi2 = 0.0000) and accept the proxy hypothesis. Hausman Test confirms that the Fixed effect model is a more fitting panel model for the study. A significant issue in macro panels with long time series (around 20-30 years) is Cross-sectional dependence. The Pesaran test is conducted to know the presence of cross-sectional independence in panels, assuming no dependence exists between the residuals of different entities. The study’s result rejects the null hypothesis with values (0.0278). A modified Wald test for group-wise heteroskedasticity was employed to identify the heteroscedasticity issue. Under this test null hypothesis is assumed as homoskedasticity (or constant variance). However, test results found that the panel had a heteroskedasticity problem and rejected the null hypothesis at P<0.05 (P=0.0000). In the presence of serial correlation R squared value increases, and the standard errors of the coefficients are narrower than they should be. Wooldridge test is applied to find out the serial correlation among the error terms in panel data, null hypothesis is that no first-order autocorrelation. It has failed to reject the null hypothesis (P = 0.3371) and concluded that there is no serial autocorrelation. As Data suffered from cross-sectional dependence and heteroscedasticity among the panels, to correct these problems in the study, FGLS and Prais Winston models (PCSE) have been applied.
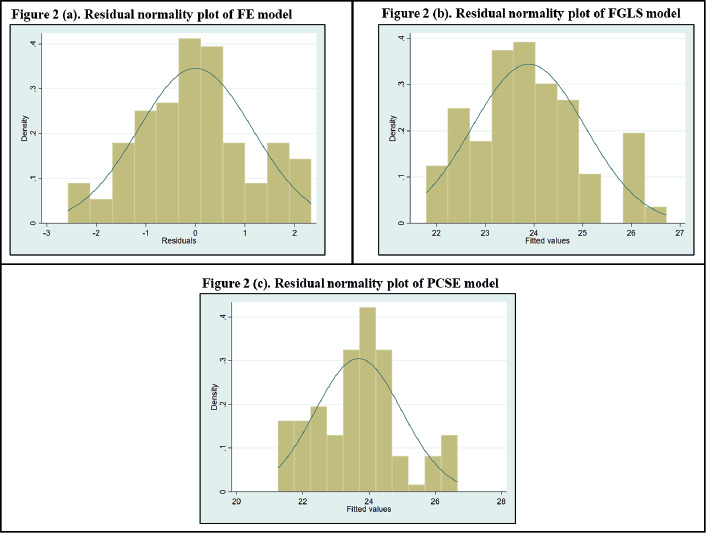
The Shapiro-Wilk W test for normal data was executed to examine the data normality with the null hypothesis (H0) that the data is not normally distributed, against the alternative hypothesis (Ha) that the data is normally distributed. In the case of the Fixed effect model, P-value is greater than 0.05 (P-value > 0.05) but less than 0.10 (P-value < 0.10), suggesting significance at 10%, rejecting null hypothesis and accepting the alternative hypothesis i.e., panel data is normal. In case of Fixed effect model. In both FGLS and PCSE models, P-value is less than 0.05 (P-value <0.05), rejecting null hypothesis and accepting the alternative hypothesis i.e., panel data is normal (See Table 3). Additionally, the histogram-based normality plot display that the residuals of FE, FGLS and PCSE models are bell-shaped with most values concentrated around the mean fitted value (See Figure 2(a), 2(b), and 2(c)). Although some deviation at the tails is present, the overall pattern follows the normal curve, suggesting that the assumption of normality of residual is not severely violated.
4. Results and Discussion
According to Table. 4’s descriptive data, the mean inward FDI is around 23.77 in natural logarithm form, with a range of 20.12 (minimum) to 26.52. (maximum). It suggests that there was some variation in the quantity of FDI received by the BRICS nations over the study period. The fundamental element of good governance indicators also stretches greatly and noticeably from one nation to the next. Indicators like PSNV (Political Stability and No-Violence) and, CoC have values ranging from 7.77 and 11 to 73.99 and 57.14%, respectively, depending on their stability level. RQ and GE also vary similarly. The average Inflation in the BRICS countries was notified as 6.81 with a range of -1.4 (minimum) and 85.74 percent (maximum). Average GDP growth in the BRICS countries registered 4.44 percent. At the same minimum and maximum growth rate is registered in the range of -7.79 to 14.23 percent.
Table 4
Descriptive statistics
Table 5 explains a correlation matrix between the variables. The explanatory variables have a fair amount of correlation. GFCF has a positive strong correlation (0.62) with the FDI inflows. HC and GDP growth have a positive but moderate correlation (0.30 and 0.29 respectively) with FDI inflows. The relationship between RoL, RQ has the highest correlation (0.7) with control of corruption. Overall, the correlation matrix shows no significant red flags.
Table 5
Correlation matrix
The empirical findings using the Fixed Effect Model (FEM), Feasible Generalized Least Squares (FGLS), and Prais-Winston panel-estimation approaches with corrected heteroskedasticity standard errors are displayed in Table 6 . The outcomes of the FE model show that (GFCF)1 and HC (School enrollment, tertiary (% gross))2 are significantly contributing in deciding the FDI inflows in the BRICS countries. Both GFCF and HC are significant at 1 percent levels and have a favourable effect on the FDI inflows in the BRICS countries. However, most of the variables are not found significant in the FE Model due to the problem of heteroscedasticity and cross-sectional dependence. The variance for each of the panels varies in many cross-sectional datasets. It is typical to have data on nations, states, or other scale-variable units. This study initially suffered from heteroscedasticity, to solve this problem FGLS and Prais-Winston regression models are applied to get the appropriate results. Experimental findings from both models showed that the variable TOP, along with GFCF and HC, at a 1% level, is significant in the determination of FDI inflows, however, TOP has an unfavourable impact on the FDI inflows in the BRICS nations with the coefficient value of -0.0266468 in FGLS model and -0.0248278 in Prais-Winston test suggesting that 1 percent increase in the trade openness will reduce the FDI inflows by 0.02 percent in the BRICS countries. Whereas, GFCF and HC (School enrollment, tertiary (% gross)) have a favourable impact on the FDI inflows in BRICS countries. A 1 percent rise in GFCF will increase the FDI inflows by 0.08 percent and a 1 percent increase in HC will increase the FDI inflows by 0.3 percent. The current study employs governance indicators to determine how FDI inflows in the host nations are impacted. The factors include the GE, CoC, PSNV, RoL, and RQ.
Table 6
Regression results under different estimation methods
GE measures people’s impressions of the caliber of government services, the civil service’s liberty from political constraints, the accuracy of policy development and execution, and the legitimacy of the government’s adherence to those policies. GE at a 5 percent level is significant, but has a negative coefficient value i.e., -0.0224924 in the case of the FGLS model and -0.0227759 in the case of the Prais- Winston model, rather than positive in the determination of FDI inflows in host countries suggesting that higher government effectiveness is associated with declining FDI inflows. Stronger government effectiveness can generally improve governance and regulatory quality, but it can also result in stricter regulations or greater compliance costs, which may discourage foreign investors (Kechagia & Metaxas, 2022). Some institutional aspects of BRICS countries do not always positively influence FDI, emphasizing that the effect of governance indicators is context-dependent and varies across countries and sectors (Jadhav & Katti, 2012). CoC reflects perceptions of how much public power is used for private gain. It is significant at 5 and 10 percent levels, but the coefficient values are negative i.e., -0.021714 in the case of the FGLS model and -0.0298009 in the case of the Prais- Winston model suggesting that an increase in the ranking of the CoC (“0” low-rank high corruption, “100” highest rank, no corruption) should decrease the inflow of FDIs in BRICS countries. This counterintuitive finding of CoC is consistent with evidence that, in some emerging economies, investors may tolerate corruption as a way to navigate rigid bureaucracies, and stricter regulations can increase compliance costs (AlSadig, 2009; Subasat & Bellos, 2013). Regulatory Quality measures how well the public believes the government can create and carry out solid laws and regulations that support and encourage the growth of the private sector. The variable RQ at 5 percent level is significant it is a vital factor in attracting the FDI inflow in the BRICS countries. Coefficient values for RQ is 0.0300113 in the case of the FGLS model and 0.0245868 in the case of the Prais- Winston model suggesting a positive impact on the FDI inflows in the BRICS countries. As expected in economic theory, a rise in one Rank of the Regulator quality will lead to an escalation in the FDI inflows of the BRICS countries. Strong regulatory quality enhances the investment climate for foreign companies by reducing administrative burdens, improving transparency, and ensuring consistent policy execution (Busse & Hefeker, 2007; Knack & Keefer, 1995). Empirical evidence indicates that countries with better regulatory quality attract more FDI due to lower compliance costs and reduced risk of arbitrary government intervention (Jadhav & Katti, 2012; Kechagia & Metaxas, 2022). The growth rate, which is significant at 5 percent, also plays a big role in drawing FDI inflows into the BRICS countries. A 1 percent rise in GDP growth is expected to increase the FDI inflows by 0.04 percent in the BRICS countries.
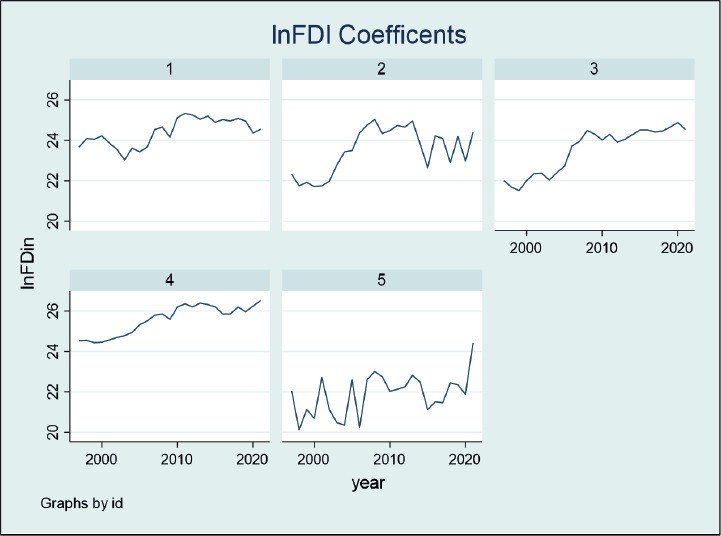
In BRICS countries trends for CoC and GE have been fluctuating over the period and to take advantage of this situation and exploit the market and gain more profit due to low CoC and GE investors are investing more in these countries i.e., depending on the nature and behavior of the investor whether market-seeker or resource seeker affects the decision to invest in the country with low corruption or high corruption, hence the analysis shows a negative association between CoC, GE and FDI inflows in the BRICS countries. Figure 3 shows the behavior of FDI coefficient for the selected countries.
The FE, FGLS, and Prais-Winsten (PCSE) models exhibit different signs and levels of significance for certain variables in the study. These inconsistencies are mainly due to different estimation methods compensating for various data problems and assumptions of the models. Although the FE model accounts for time-invariant heterogeneity, it does not fully correct for cross-sectional dependence heteroskedasticity, which affects the magnitude of the variables. In contrast, heteroskedasticity, autocorrelation, and cross-sectional dependence are common features in macro-panel datasets such as BRICS and are explicitly addressed the FGLS and Prais-Winsten PCSE estimators that often result in more effective but marginally different coefficient estimates. Existing literature, such as Busse & Hefeker, (2007); Jadhav & Katti (2012), emphasizes how model specification and estimation decisions affect institutional and political variables, particularly in emerging economies where political risks, institutional quality, and governance performance differ greatly between nations and over time. Such variation can result in divergent results across different econometric methods. Estimates of the current study also reflect the complex and multidimensional nature of institutional effects on FDI.
5. Theoretical implications
FDIs are essential for economic growth, and its inflow is majorly determined by the macroeconomic, political, and institutional factors of the host nations. From a macroeconomic perspective, stable economic growth, inflation rate, exchange rate, and capital formation are fundamental factors to attract the FDIs. As per neoclassical growth theory, macroeconomic stability reduces the uncertainty and is good for long–run investment decisions (Blonigen, 2005). Countries exhibiting strong GDP growth are often perceived as offering expanding market opportunities, encouraging market-seeking FDI (Borensztein, et.al., 1998). Theories of political economy suggest that investors prefer to invest in politically stable nations. The governance environment of the host country affects both domestic and foreign investors. Political risk increases the uncertainty and hinders the long-run investments (Jensen, 2003). Also, institutions set the rule that shapes the economic performance of the host nation (North, 1990). As per the institutional theory, investors are likely to invest in nations with certain and credible institutional arrangements (Globerman and Shapiro, 2003). Theoretically, sound macroeconomic, strong political, and institutional variables simultaneously operate within an interconnected framework to attract the FDIs.
6. Practical implications
Practically, it is essential for policymakers, international business managers, and investors to understand macroeconomic, political, and institutional factors of the host nation to optimize FDI strategies. These variables shape the decision-making of multinational corporations (MNCs) and also influence the host nations position in the global investment landscape. For policymakers, a stable macroeconomic situation can increase investors confidence and create conditions for long-run investment in the host nations. As for the business managers, macroeconomic indicators serve as key inputs in country risk assessments and market entry strategies. Furthermore, stable and certain governance reduces the political risk and fosters a safe investment environment. For policymakers, it is essential to maintain credible political institutions and ensure a smooth transition of power. Moreover, MNCs prefer nations with stable democratic governance and sound legal systems, as these factors reduce the risk of exploitation. Political instability, on the other hand, can lead firms to delay investments or redirect capital to more stable regions. Institutional variables such as regulatory framework, control of corruption, and efficient bureaucracy also play an essential role in shaping FDI inflows, as they reduce transaction costs and enhance operational efficiency. For policymakers of the host nation, it is essential to strengthen the institutions to attract FDI. MNCs must also evaluate the institutional qualities when selecting locations for potential investments, especially in emerging nations, as their institutional performance varies widely. A robust institutional setup enables firms to operate more autonomously and confidently in a foreign jurisdiction. Hence, for the policymakers of the host nation and MNCs, the FDI inflows are optimized in stable macroeconomic conditions along with a reliable political situation and strong institutional quality coverage. Effective management of macroeconomic, political, and institutional factors attracts the FDI and ensures the long–run investors satisfaction and positive economic development.
7. Conclusion and policy recommendations
FDIs have the potential to bring in capital that can be used to account for new propositions, outspread existing businesses, and create new jobs, which can stimulate the economic growth and development of the host countries. Multinational corporations often bring new technologies, managerial expertise, and technical know-how to the host country, which can improve productivity and efficiency and help local firms to compete more effectively in global markets. FDI can create new jobs in the host country, particularly in industrial sectors such as manufacturing, services, and tourism. Furthermore, FDI can help to boost exports from the host country, as multinational corporations often use the host country as a base for producing goods or services for export. The present study examines the significant determinates of FDI inflows into the BRICS countries such as Gross fixed capital formation, human capital, economic growth, Trade openness, Government effectiveness, Control of corruption and Regulatory control. The four variables i.e., Gross fixed capital formation, human capital, economic growth, and Regulatory control are significant and positively impact the FDI inflows into the BRICS countries. It discloses and concludes that multinational firms are looking for the following facilities in emerging economies like in BRICS countries in the way of investing in those countries, such as infrastructure facilities, sufficient human capital who qualified tertiary education or skilled labour, government interests in laws and regulations in encourage of the growth of the private sector. Moreover, the Trade openness, Government effectiveness, Control of corruption are significant, however, they do not have positive coefficient values.
Coinciding with the findings of the present study, certain measures can be adopted by investors and the authorities of the host nations to increase the FDI inflows in. These measures include that investors must look into the regulatory framework and quality of the business environment of the host nation to short-list the potential sectors for investment and should invest in those sectors where investor’s objectives are fulfilled and their working strategies are best fit. Human capital affects the FDI inflows favour-ably. So, BRICS countries need to enhance their human capital by providing them with quality education and working skills as the rising FDI demands workers who can operate the suffocated machinery and enhance the quality of the product as well as productivity. Along with it, BRICS countries need to provide the investors/MNCs with all the basic facilities needed to establish a production unit and conduct regular public-private dialogue to create a business-friendly environment for the investors/MNCs.